3. Aboriginal grain belt
using mathematical modelling to investigate the proportion of land mass/area of Aboriginal Peoples’ traditional grain belt compared with Australia’s current grain belt
3.1. Modelling
The total land area of Australia
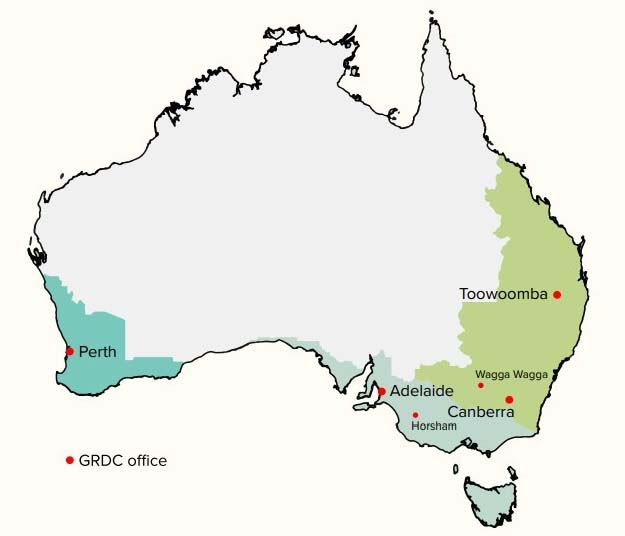
The land area of the current wheat belt
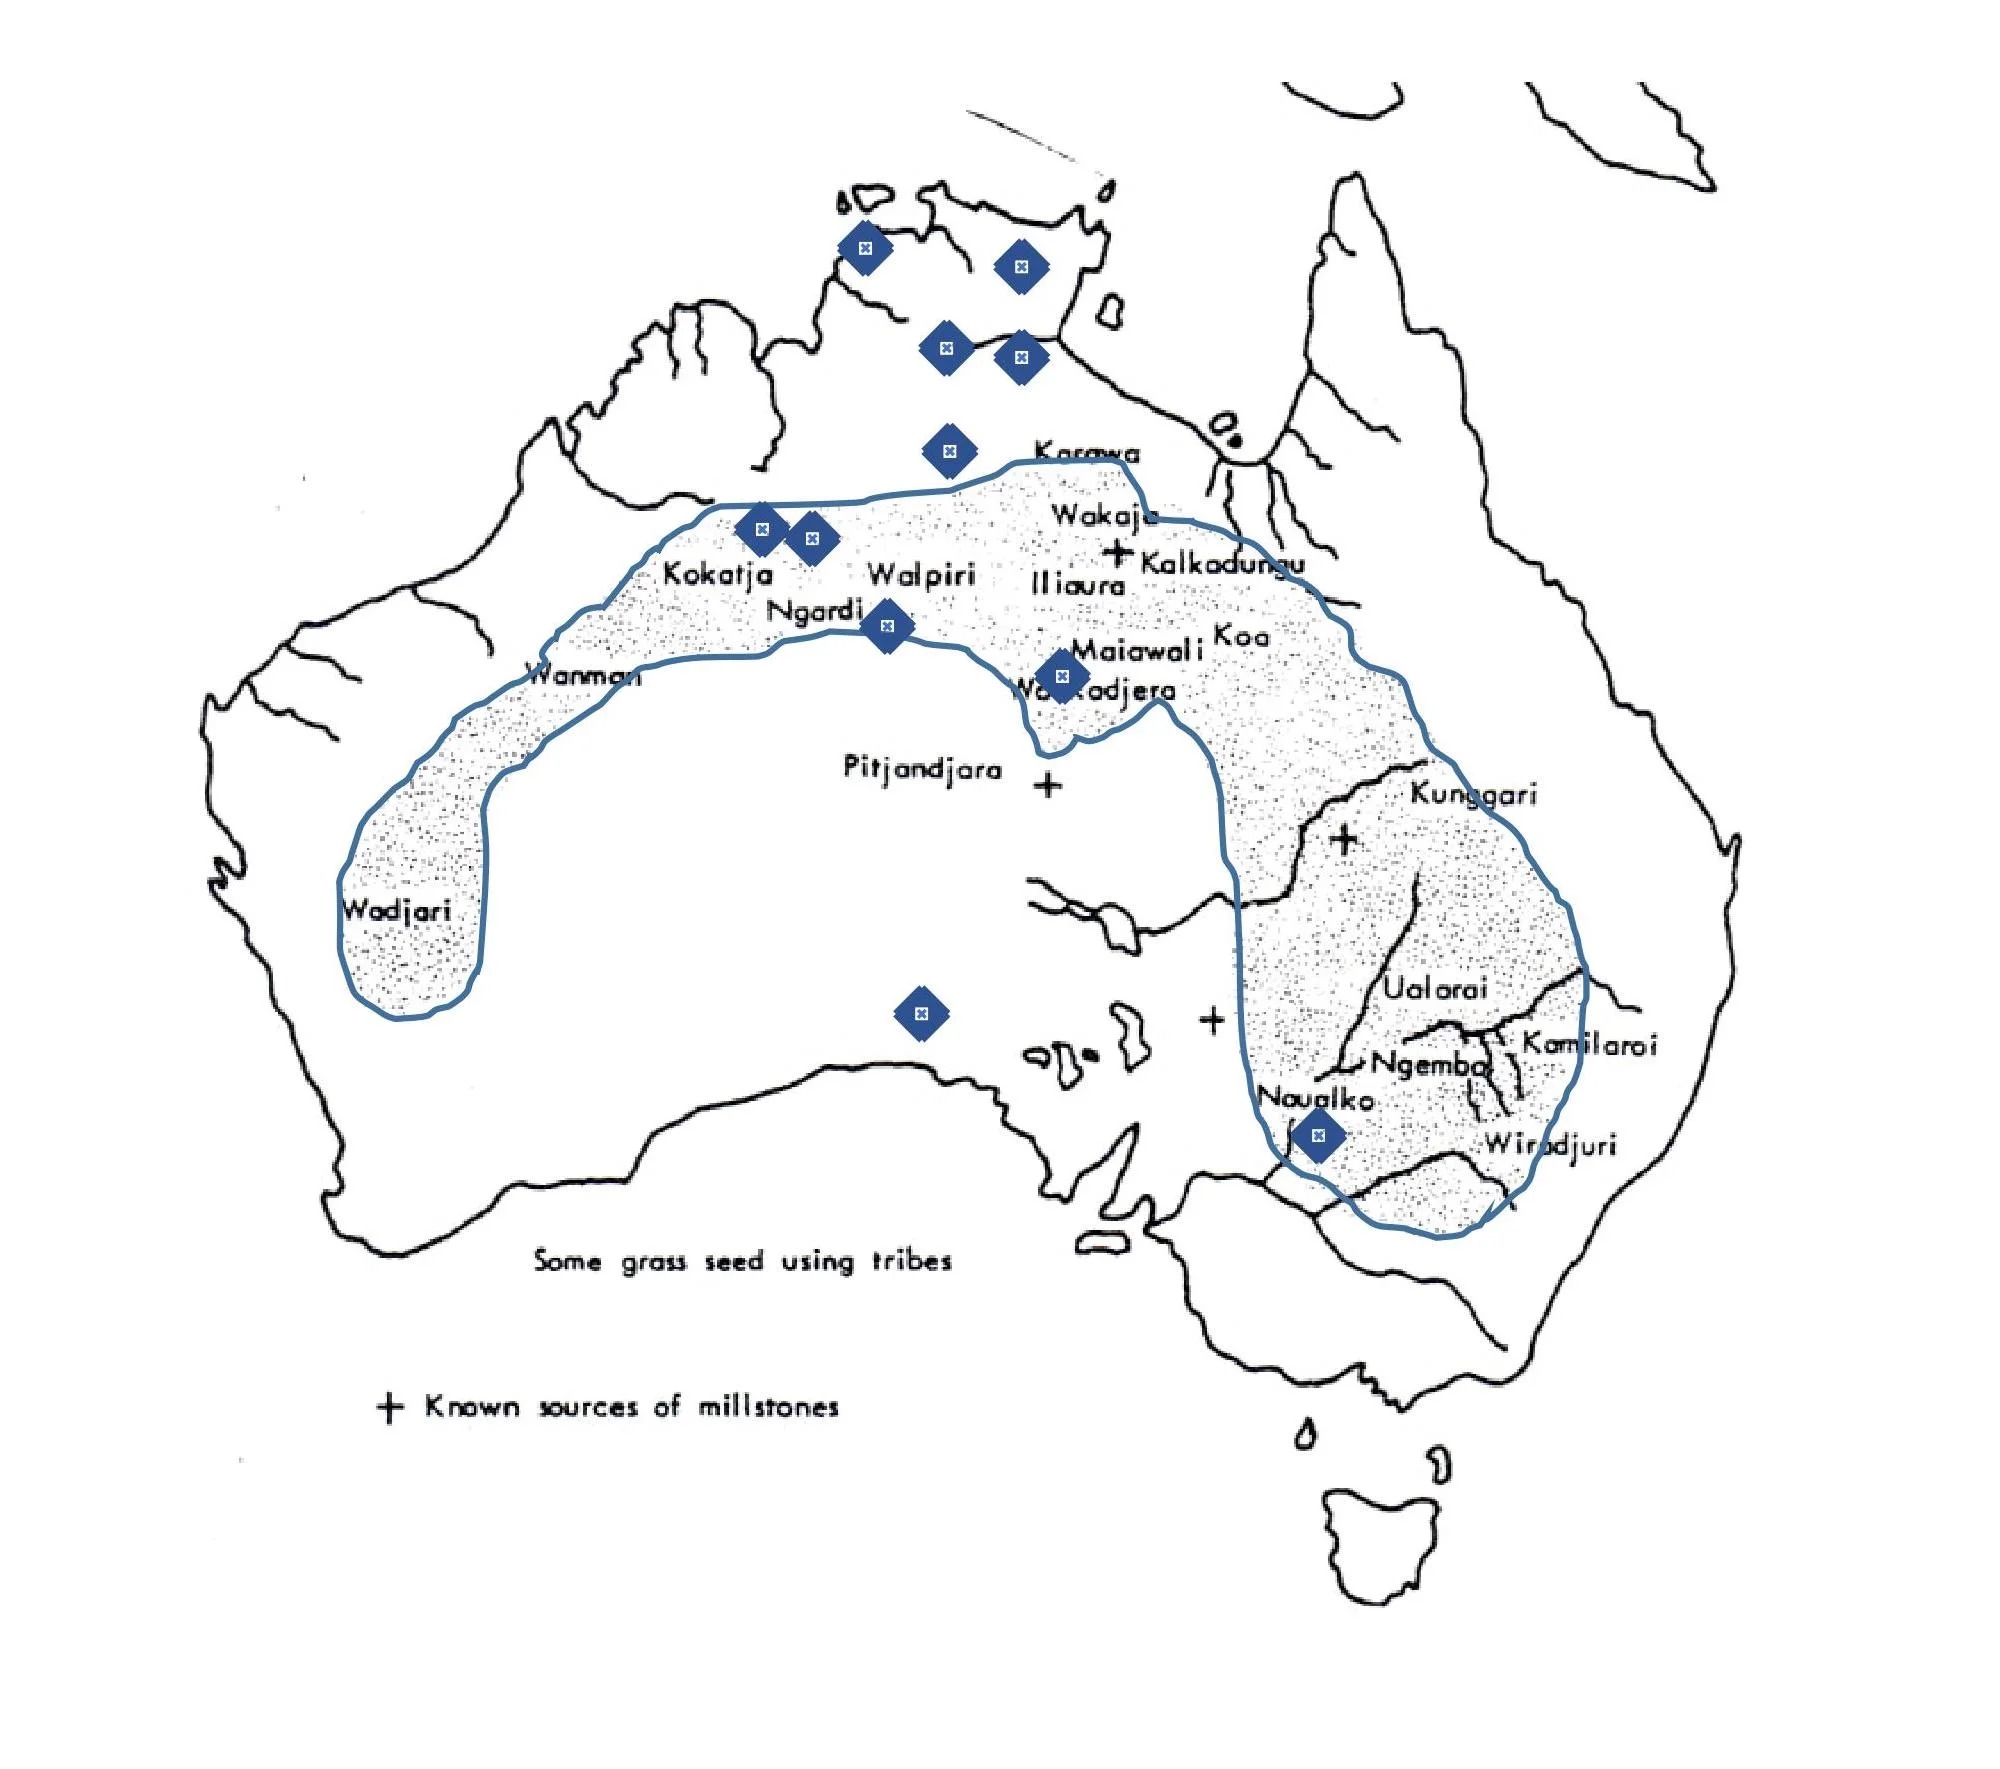
The land area of the Indigenous grain belt

3.2. Steps for Mathematical Modelling
Define the regions - Obtain maps showing the traditional Aboriginal grain belt (where native grains like microlaena or panicum were cultivated) and the current Australian grain belt (primarily wheat and barley regions). - Represent each region as a polygon or shape on a coordinate grid.
Overlay a geometric tiling (honeycomb pattern) - Use dynamic geometry software (e.g. GeoGebra) to overlay a hexagonal grid across the map. - Each hexagon represents a unit of land area.
Count and compare proportions - Count how many hexagons fall within the traditional grain belt. - Count how many hexagons fall within the current grain belt. - Calculate the proportion:
[ text{Proportion} = frac{text{Hexagons in traditional belt}}{text{Hexagons in current belt}} ]
Interpret the result - Express the proportion as a percentage. - Communicate what this means in terms of land use change — e.g. “The traditional grain belt covered about 40% of the area of today’s grain belt.”
3.3. Using GeoGebra
Open GeoGebra Geometry or GeoGebra Classic - Go to [GeoGebra](https://www.geogebra.org/geometry). - Import or insert an image of the map you want to study (e.g. Australia’s grain belt regions).
Create a hexagon tile - Use the Polygon tool to draw a regular hexagon. - Alternatively, type in the input bar:
`
RegularPolygon[(0,0),(1,0),6]
`
This makes a hexagon with side length 1.Duplicate the hexagon to form a grid - Use the Translate by Vector tool to copy the hexagon horizontally and vertically. - For a honeycomb effect, shift every second row by half a hexagon width. - Repeat until the grid covers the entire map area.
Overlay the grid on the map - Adjust transparency of the hexagons (right-click → Object Properties → Color → Opacity). - Position the grid so it covers both the traditional grain belt and the current grain belt.
Count and compare areas - Count how many hexagons fall inside each region. - Calculate proportions:
[ text{Proportion} = frac{text{Hexagons in traditional belt}}{text{Hexagons in current belt}} ]
Express as a percentage and interpret in context.