9. Matplotlib plot 1 line
Matplotlib can be used to draw a line graph.
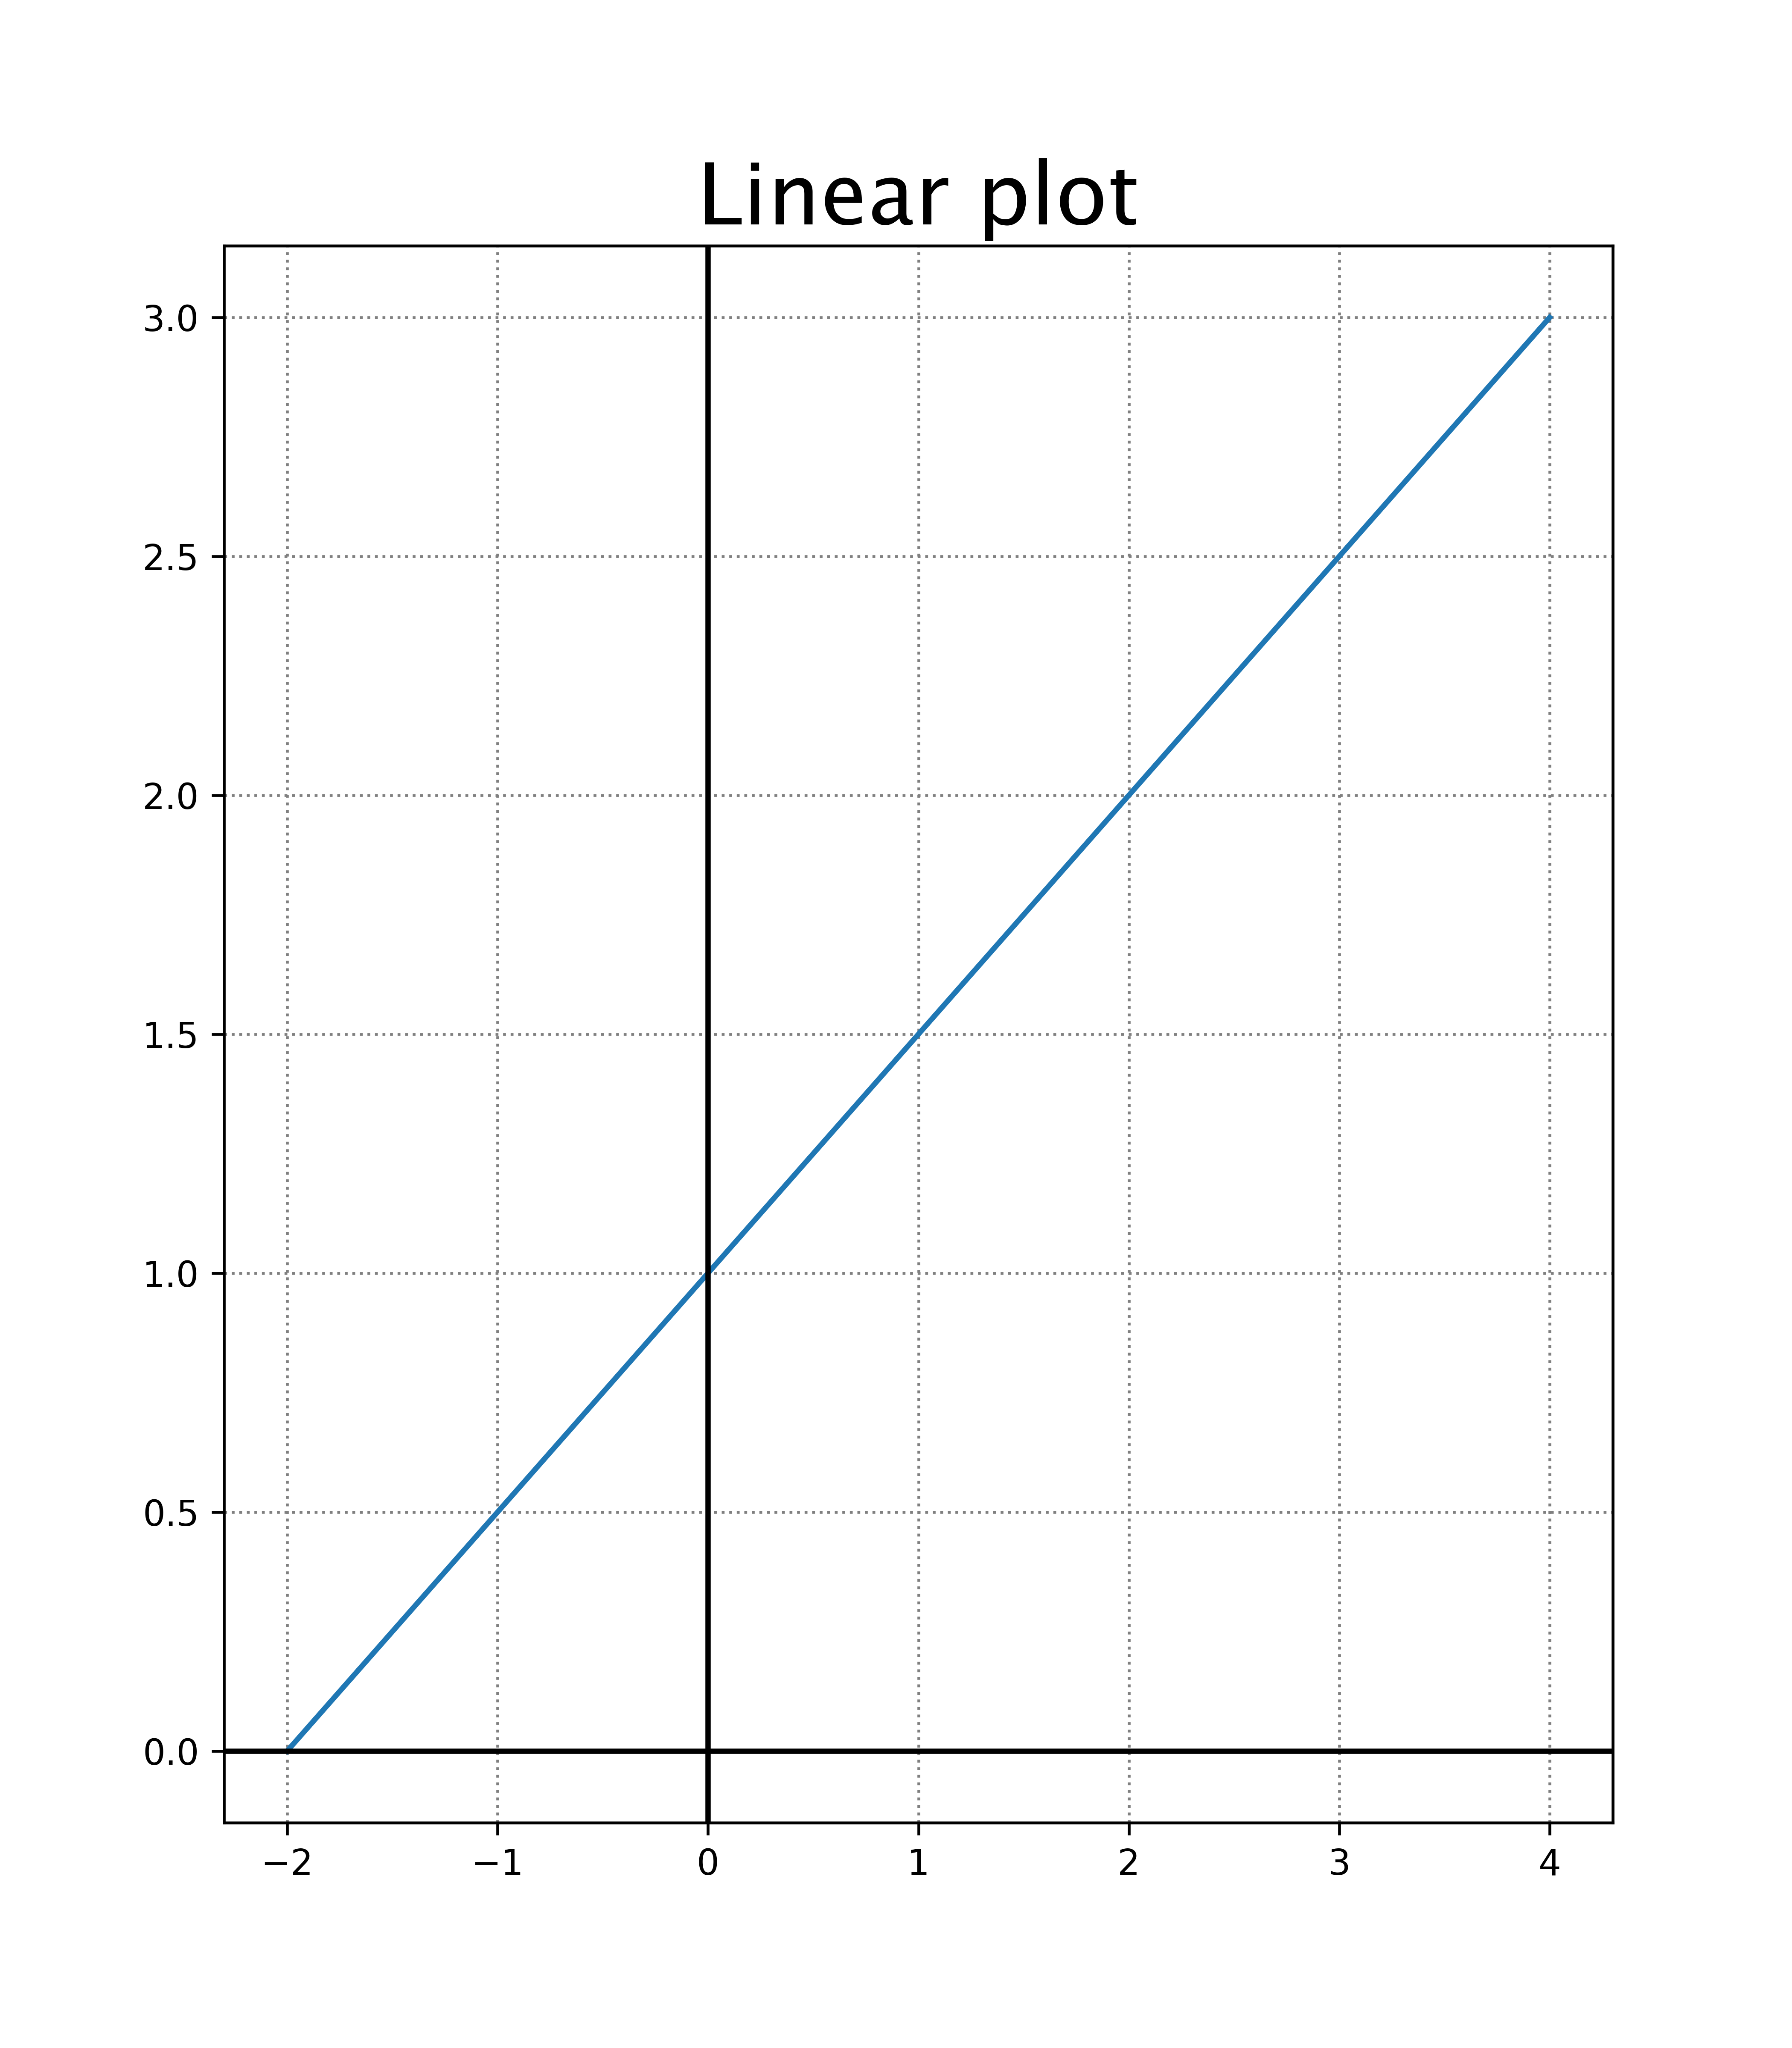
9.1. Simple Linear plot
This is a basic plot for the equation :raw-latex:`$y = \\frac{x}{2} + 1$`.
It has a grid and X and Y axes.
9.2. Python code
The python code is below.
The code is commented to indicate what each part is doing.
 1import numpy as np
 2import matplotlib.pyplot as plt
 3
 4
 5def plot_line_graph(title, equation, min_x, max_x):
 6    """
 7    Plots a line graph of the equation y = eval(equation) over the range of x values from min_x to max_x.
 8
 9    Parameters:
10    title (str): The title of the graph.
11    equation (str): The equation to plot.
12    min_x (int): The minimum value of x to plot.
13    max_x (int): The maximum value of x to plot.
14
15    Returns:
16    None
17    """
18    # Define the range of x values
19    x = np.arange(min_x, max_x + 1)
20    # Calculate the corresponding y values as a np array using the x values.
21    y = eval(equation)
22    # set size and resolution
23    plt.figure(figsize=(7, 8), dpi=100)
24    # Plot the line graph
25    plt.plot(x, y)
26    # Add a x, y axis black solid lines through the origin
27    plt.axhline(0, color="k", linestyle="-")
28    plt.axvline(0, color="k", linestyle="-")
29    # add a grid, grey as dots
30    plt.grid(True, color='grey', linestyle=':')
31    # Add a title (specify font parameters with fontdict)
32    plt.title(title, fontdict={"fontname": "Lucida Sans", "fontsize": 24})
33    # Show plot
34    plt.show()
35
36
37def main():
38    plot_line_graph("Linear plot", "x/2 + 1", -2, 4)
39
40
41if __name__ == '__main__':
42    main()
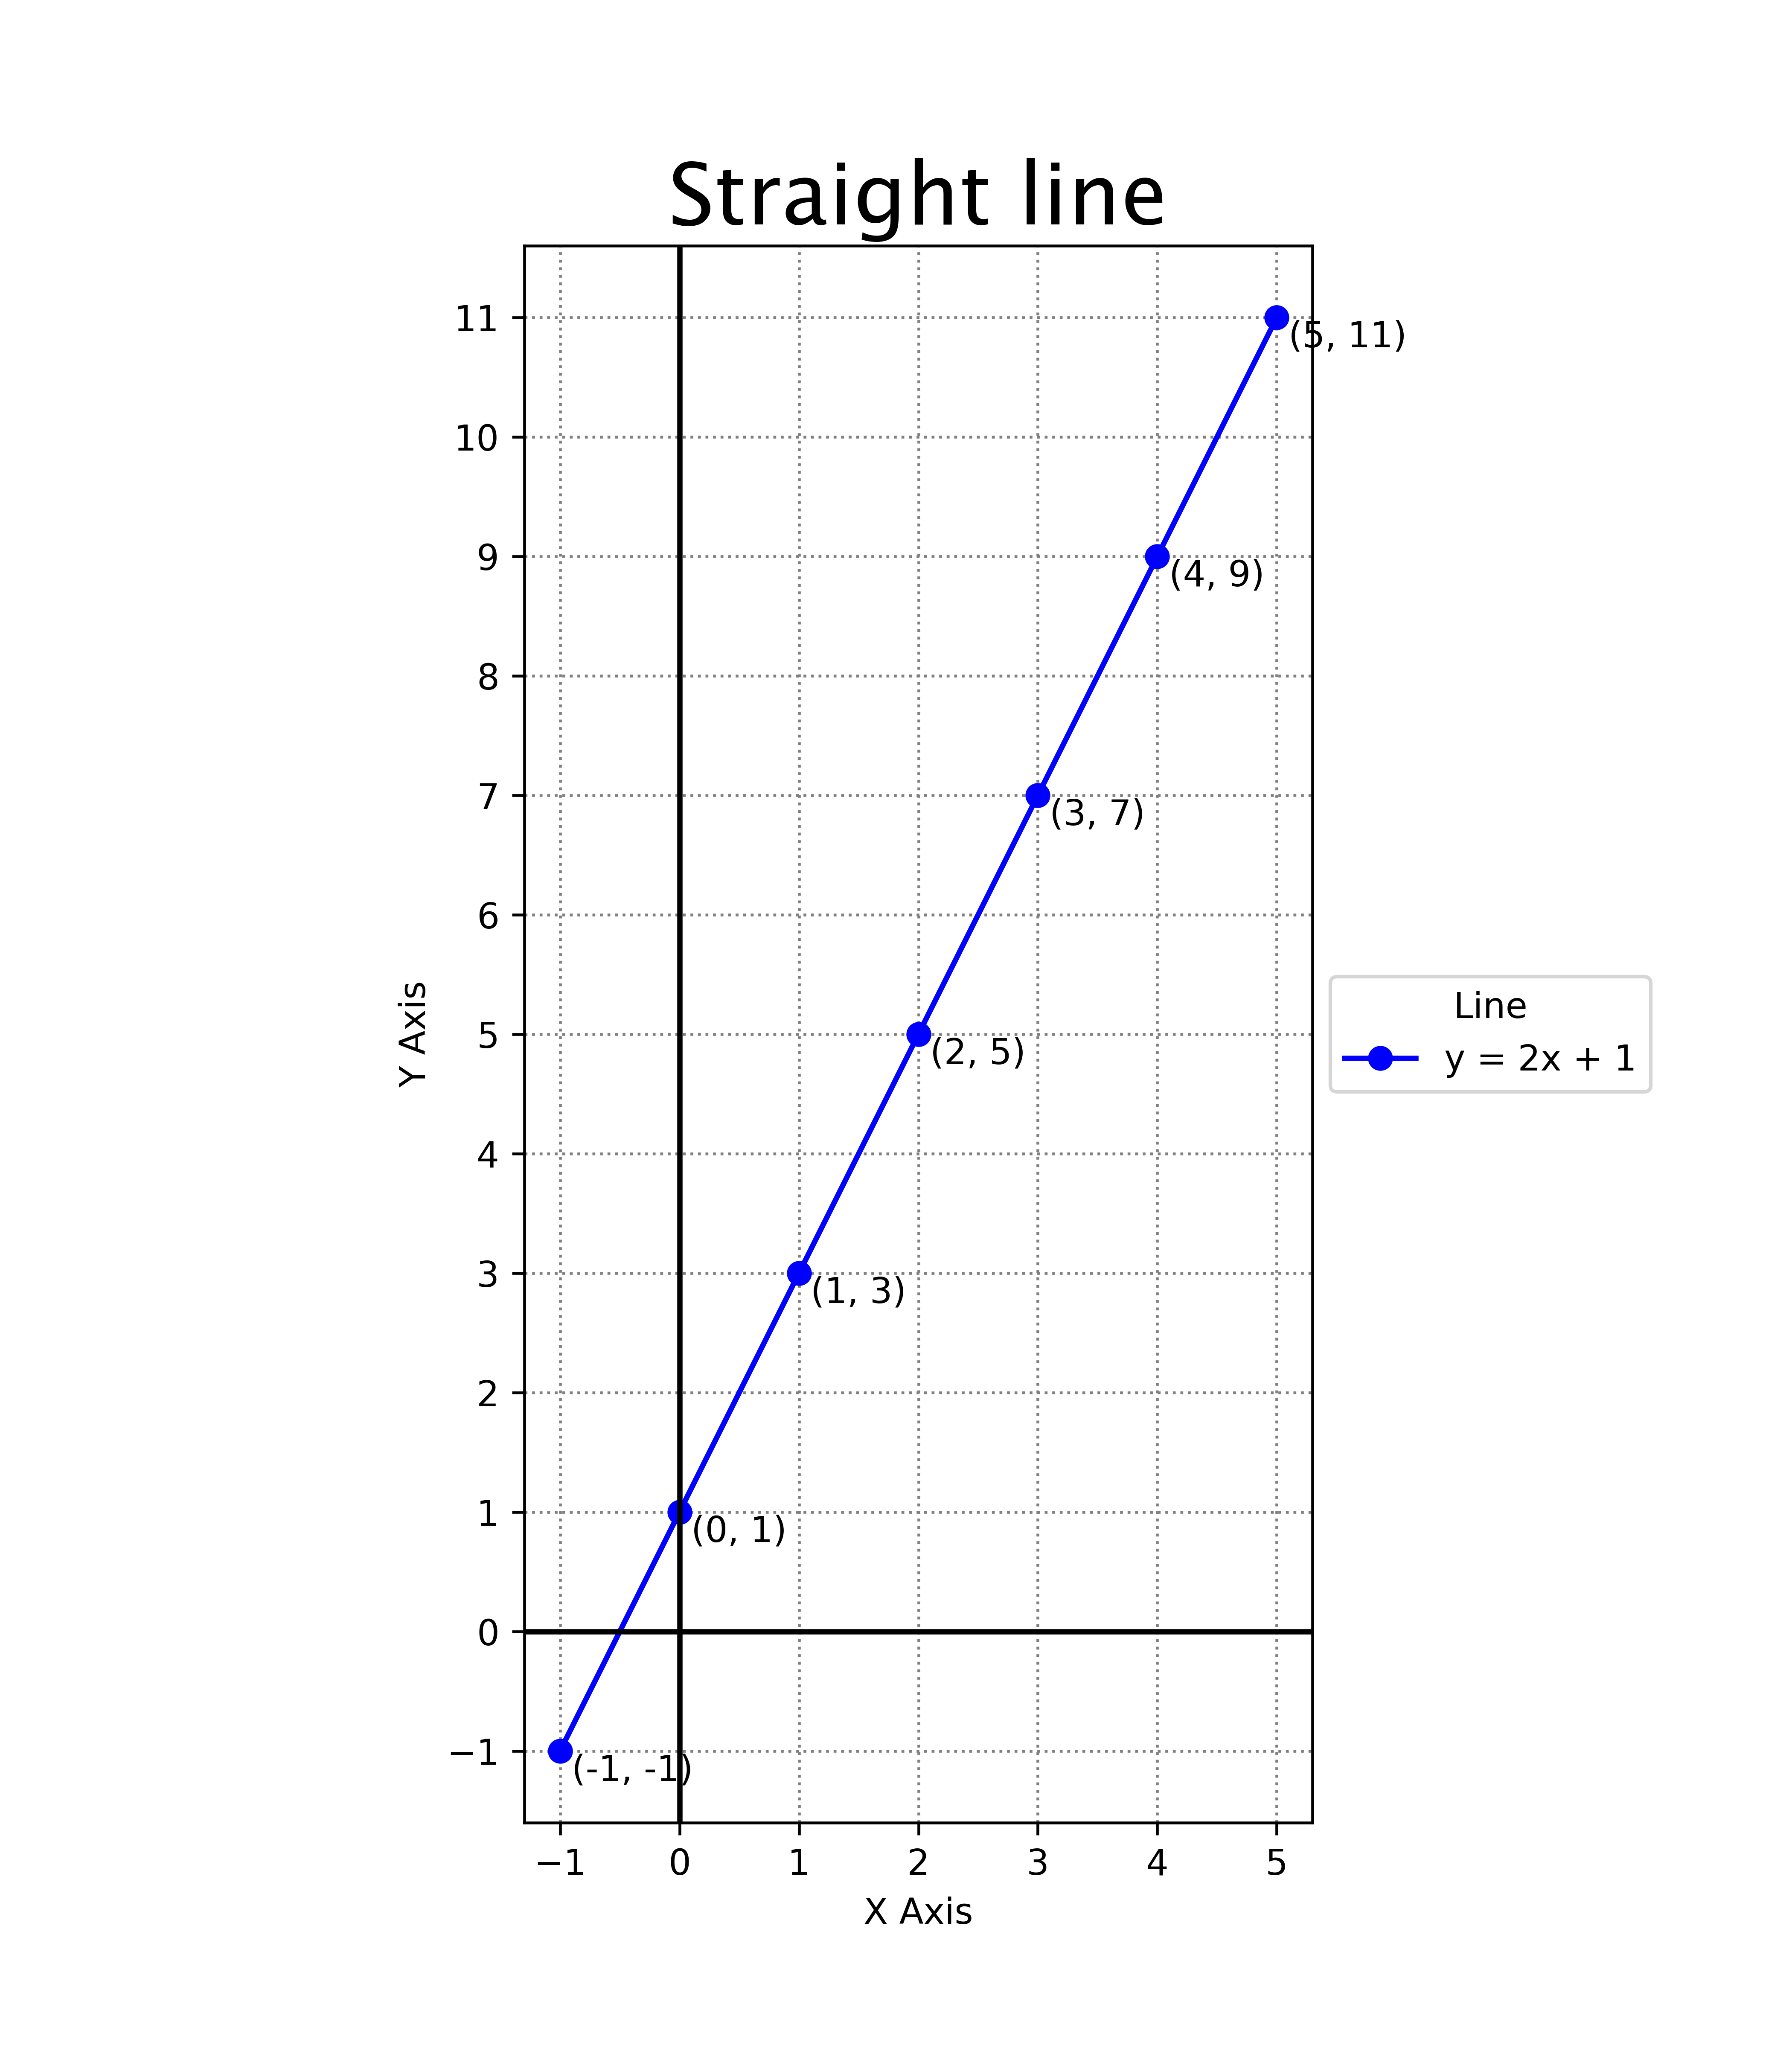
9.3. Straight line graph to scale
This is a plot for the equation y =2x + 1
This plot has more customizations added.
It has code to save the plot as a png file.
9.4. Python code
The python code is below.
The code is commented to indicate what each part is doing.
 1from pathlib import Path
 2import numpy as np
 3import matplotlib.pyplot as plt
 4
 5
 6def plot_line_graph(title, equation, label):
 7    """Plots a line graph of a given equation and labels it.
 8
 9    Args:
10        title (str): The title of the graph.
11        equation (str): A string representing the equation to be plotted.
12        label (str): A string representing the label for the equation.
13
14    Returns:
15        None
16    """
17    # Define the range of x values
18    x = np.arange(-1, 6)
19    # Calculate the corresponding y values as a np array using the x values.
20    y = eval(equation)
21    # set size and resolution
22    plt.figure(figsize=(7, 8), dpi=100)
23    # Plot the line graph
24    plt.plot(x, y, "bo-", label=label)
25    # Add a x, y axis black solid lines through the origin
26    plt.axhline(0, color="k", linestyle="-")
27    plt.axvline(0, color="k", linestyle="-")
28    # add a grid, grey as dots
29    plt.grid(True, color='grey', linestyle=':')
30    # Add a title (specify font parameters with fontdict)
31    plt.title(title, fontdict={"fontname": "Lucida Sans", "fontsize": 24})
32    # X and Y labels
33    plt.xlabel("X Axis")
34    plt.ylabel("Y Axis")
35    # specify X, Y axis Tickmarks (will resize graph)
36    plt.xticks(list(x))
37    # Set y-axis tick marks to be every 1 instead of 2
38    y_min = int(min(y))
39    y_max = int(max(y))
40    plt.yticks(range(y_min, y_max+1))
41    # Set the aspect ratio of the axes to be equal
42    plt.gca().set_aspect('equal')
43    # Label each point on the graph
44    for i in range(len(x)):
45        plt.text(x[i]+0.1, y[i]-0.25, f"({x[i]}, {y[i]})", fontsize=10)
46    # Place legend outside plot at top right, making extra room for it
47    plt.legend(title="Line", loc='center left', bbox_to_anchor=(1.00, 0.5))
48    # Get the directory of the current file
49    currfile_dir = Path(__file__).parent
50    # Replace spaces in title with underscores to create filename for saving figure
51    filename = title.replace(" ", "_")
52    # build the image file path
53    filepath = currfile_dir / (f"{filename}.png")
54    # Save figure (dpi 300 is good when saving so graph has high resolution)
55    plt.savefig(filepath, dpi=600)
56    # Show plot
57    plt.show()
58
59
60def main():
61    plot_line_graph("Straight line", "2 * x + 1", "y = 2x + 1")
62
63
64if __name__ == '__main__':
65    main()