4. Matplotlib dot plot
Matplotlib can be used to draw a dot plot.
4.1. Examples

The Python function, dot_plot, creates a dot plot.
It takes in two arguments: data and title.
The function creates a dot plot of the given data with the specified title.
The data is plotted using the matplotlib library.
The function first calculates the counts of each unique value in the data using the np.unique function from the numpy library.
Then, it sets some formatting parameters based on the range and counts of the data.
The function then creates a dot plot using a loop to plot each unique value and its count.
The plot is formatted to hide some spines and the y-axis, set the y-axis limits, and set the x-axis ticks.
The bottom margin is adjusted to leave space for x labels, and a title is added using the title argument.
Finally, the figure is saved to a file and displayed using the plt.show() function.
Below is code to create all 4 example images above.
1import numpy as np
2import matplotlib.pyplot as plt
3from pathlib import Path
4
5
6def dot_plot(data, title):
7 """
8 Create a dot plot of the given data with the specified title.
9
10 Parameters:
11 data (array-like): The data to plot.
12 title (str): The title of the plot.
13
14 Returns:
15 None
16 """
17 # Get the unique values in the data and their counts
18 values, counts = np.unique(data, return_counts=True)
19 # Set formatting parameters based on the range of the data
20 data_range = max(values)-min(values)
21 width = 1 + data_range/2 if data_range<30 else 15
22 height = 1.2 + max(counts)/3 if data_range<30 else 2 + max(counts)/4
23 marker_size = 10 if data_range<50 else np.ceil(30/(data_range//10))
24 # Create a new figure with the specified size
25 plt.figure(figsize=(width, height))
26 # Plot the data as a series of dots, with one dot for each count of each value
27 for value, count in zip(values, counts):
28 plt.plot(
29 [value] * count,
30 list(range(count)),
31 marker="o",
32 color="tab:blue",
33 ms=marker_size,
34 linestyle="",
35 )
36 # Get the current Axes object
37 ax = plt.gca()
38 # Hide the top, right, and left spines of the plot
39 for spine in ["top", "right", "left"]:
40 ax.spines[spine].set_visible(False)
41 # Hide the y-axis
42 ax.yaxis.set_visible(False)
43 # Set the y-axis limits to include all of the data points
44 ax.set_ylim(-1, max(counts))
45 # Set the x tick locations to be at integer values from the minimum to the maximum value in the data
46 ax.set_xticks(range(min(values), max(values) + 1))
47 # Adjust the bottom margin of the plot to leave space for the x tick labels
48 cms = 0.5 * 1/2.54 # inches per cm
49 plt.subplots_adjust(bottom=cms)
50 # Add a title to the plot with the specified text and formatting
51 title_str = title.title()
52 ax.set_title(f"{title_str}", fontdict={"fontname": "Arial", "fontsize": 12})
53 # Get the directory of the current file
54 currfile_dir = Path(__file__).parent
55 # Replace spaces in title with underscores to create filename for saving figure
56 filename = title.replace(" ", "_")
57 # build the image file path
58 filepath = currfile_dir / (f"{filename}.png")
59 # Save figure (dpi 300 is good when saving so graph has high resolution)
60 plt.savefig(filepath, dpi=600)
61 # Show the plot on the screen
62 plt.show()
63
64
65def norm_sample_data(min, max, mu, sigma, n):
66 """
67 Generate n sample points from a normal distribution with mean mu and standard deviation sigma, clipped to the range [min, max] and converted to integers.
68
69 Parameters:
70 min (int): The minimum value of the range to clip the sample data to.
71 max (int): The maximum value of the range to clip the sample data to.
72 mu (float): The mean of the normal distribution to sample from.
73 sigma (float): The standard deviation of the normal distribution to sample from.
74 n (int): The number of sample points to generate.
75
76 Returns:
77 numpy.ndarray: An array of n integers sampled from a normal distribution with mean mu and standard deviation sigma, clipped to the range [min, max].
78 """
79 # Generate an array of n random values sampled from a normal distribution with mean mu and standard deviation sigma
80 s = np.random.normal(mu, sigma, n)
81 # clip values outside the range [min, max]
82 s = np.clip(s, min, max)
83 # convert to integers
84 s = s.astype(int)
85 return s
86
87
88def random_data(min, max, n):
89 """
90 Generate an array of n random integers between min and max, inclusive.
91
92 Parameters:
93 min (int): The minimum value of the range to generate random integers from.
94 max (int): The maximum value of the range to generate random integers from.
95 n (int): The number of random integers to generate.
96
97 Returns:
98 numpy.ndarray: An array of n random integers between min and max, inclusive.
99 """
100 # create a random number generator without a fixed seed
101 rng = np.random.default_rng()
102 # generate an array of n random integers between min and max, inclusive
103 data = rng.integers(min, max + 1, size=n)
104 # return the generated data
105 return data
106
107
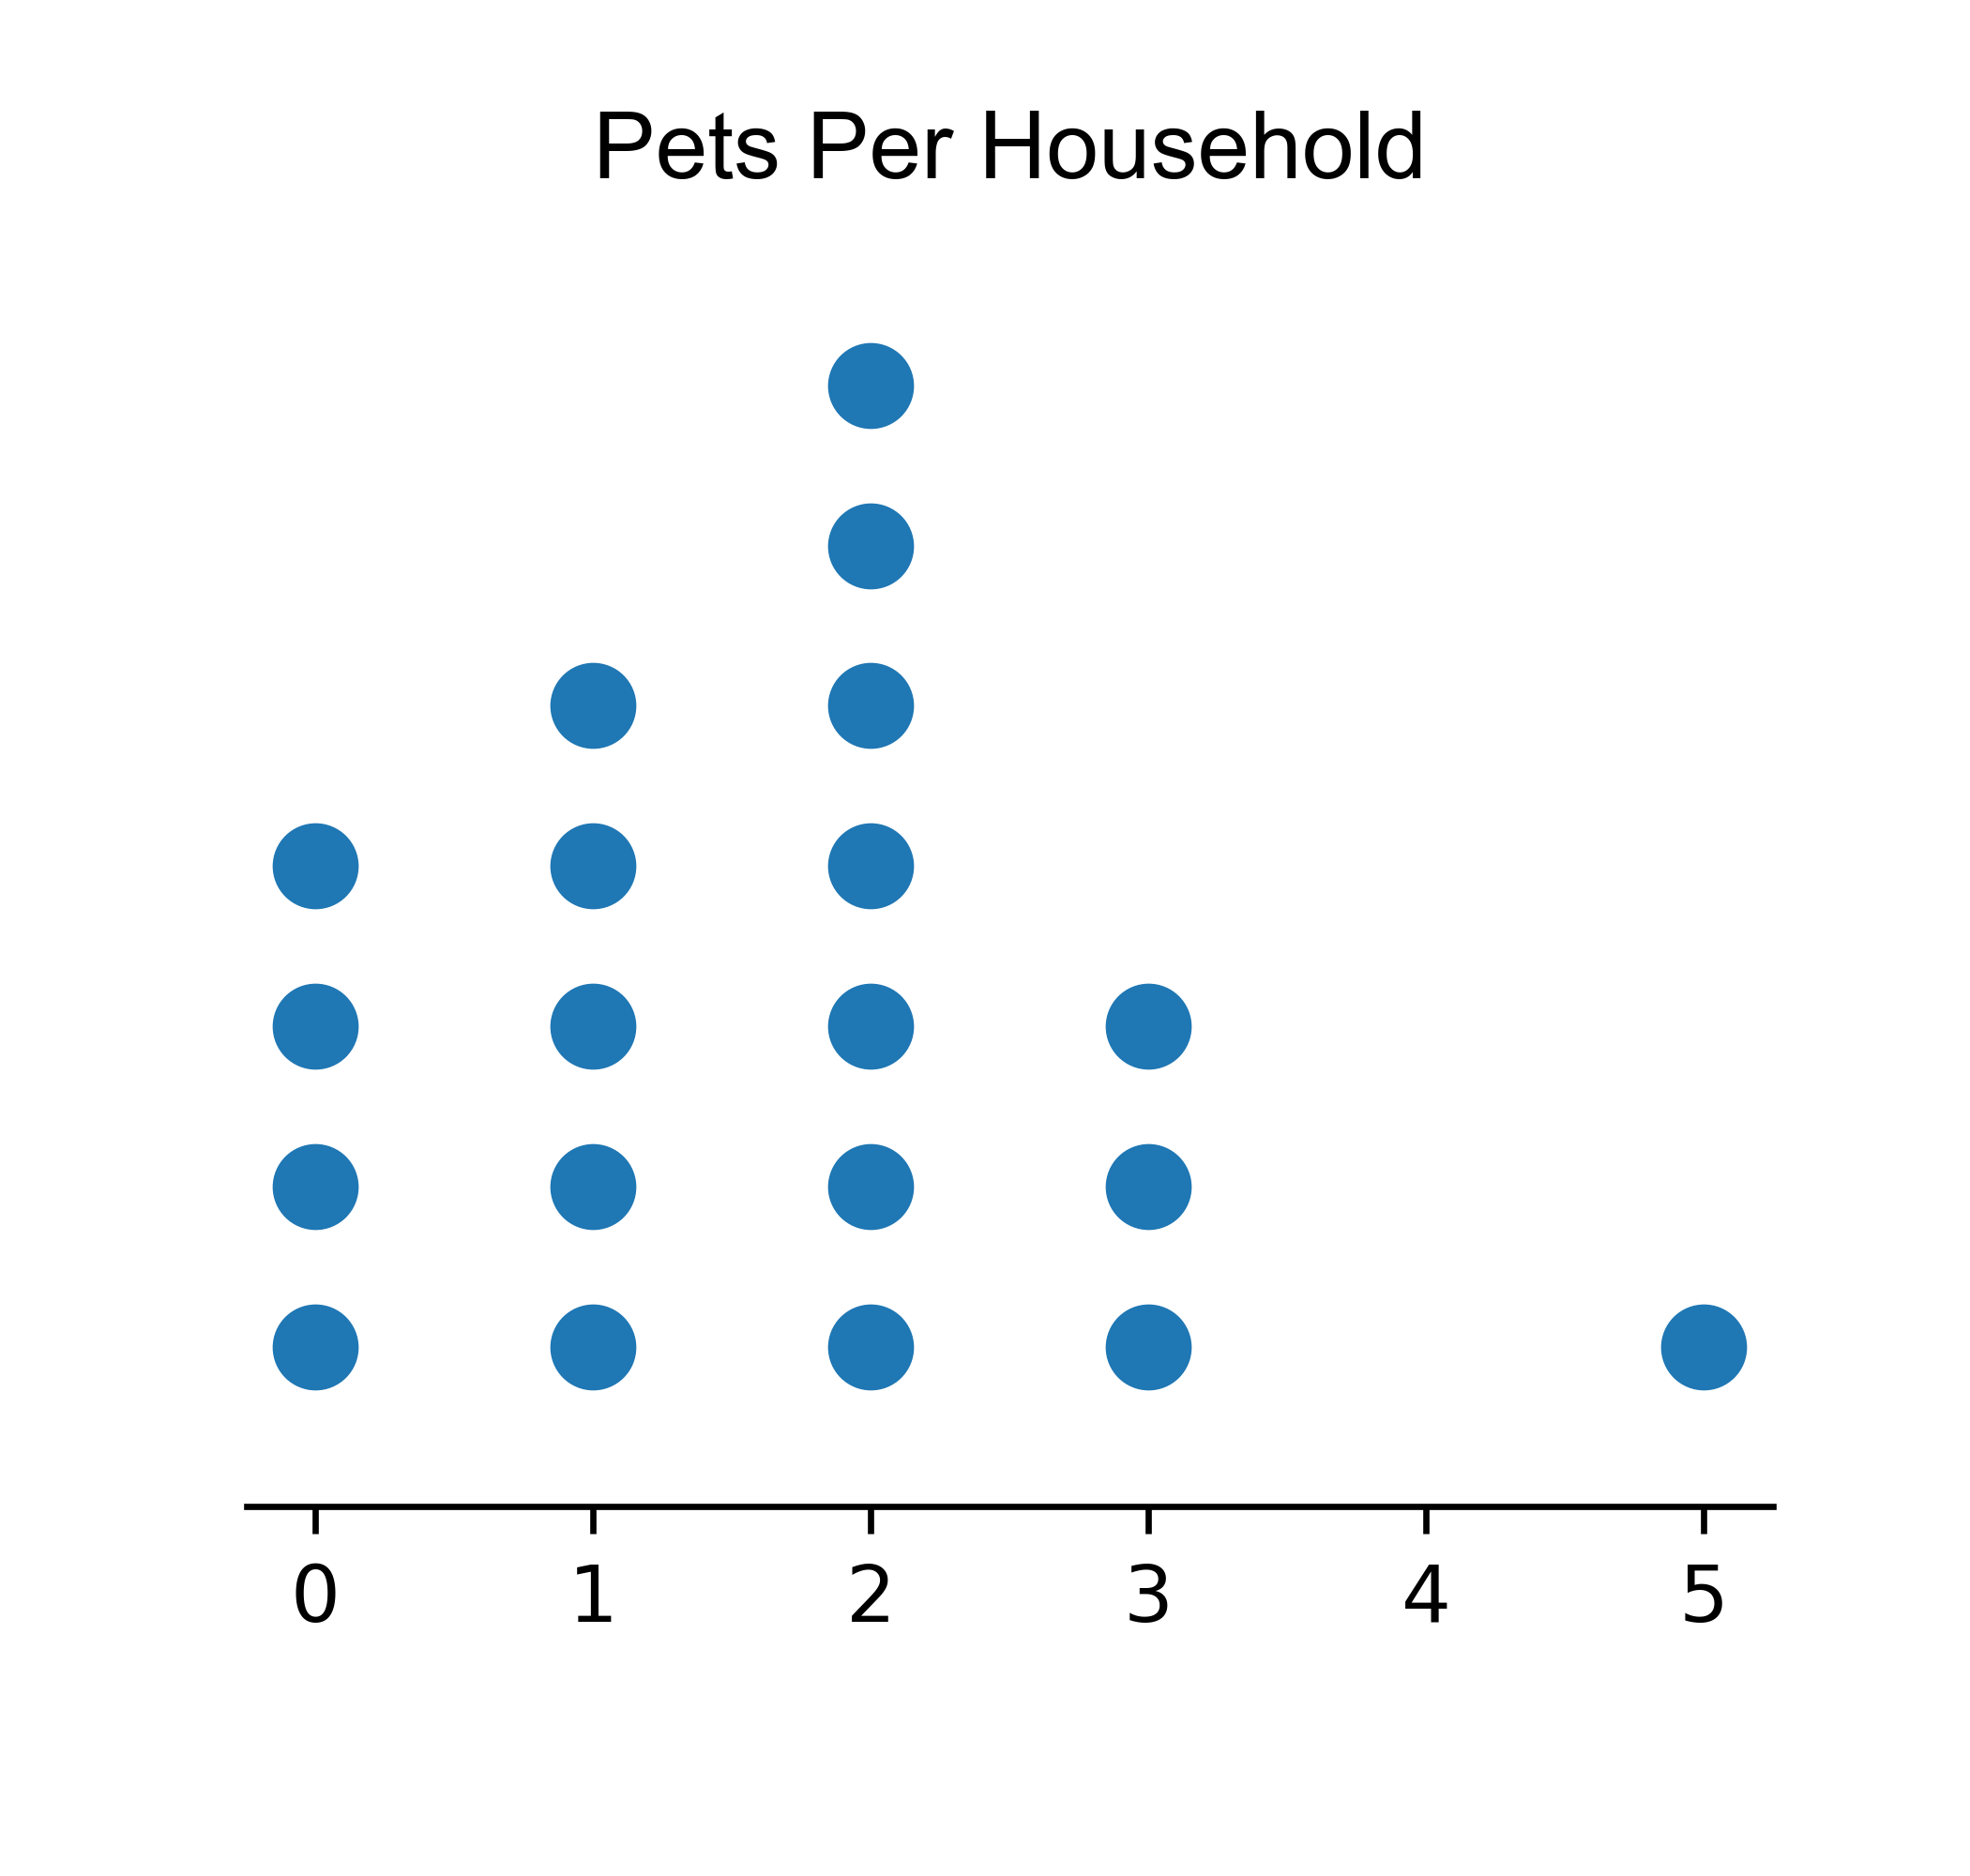
108def dot_pets():
109 data = [1, 2, 3, 2, 0, 1, 0, 2, 5, 3, 2, 1, 2, 0, 2, 0, 1, 3, 2, 1]
110 title = "pets per household"
111 dot_plot(data, title)
112
113
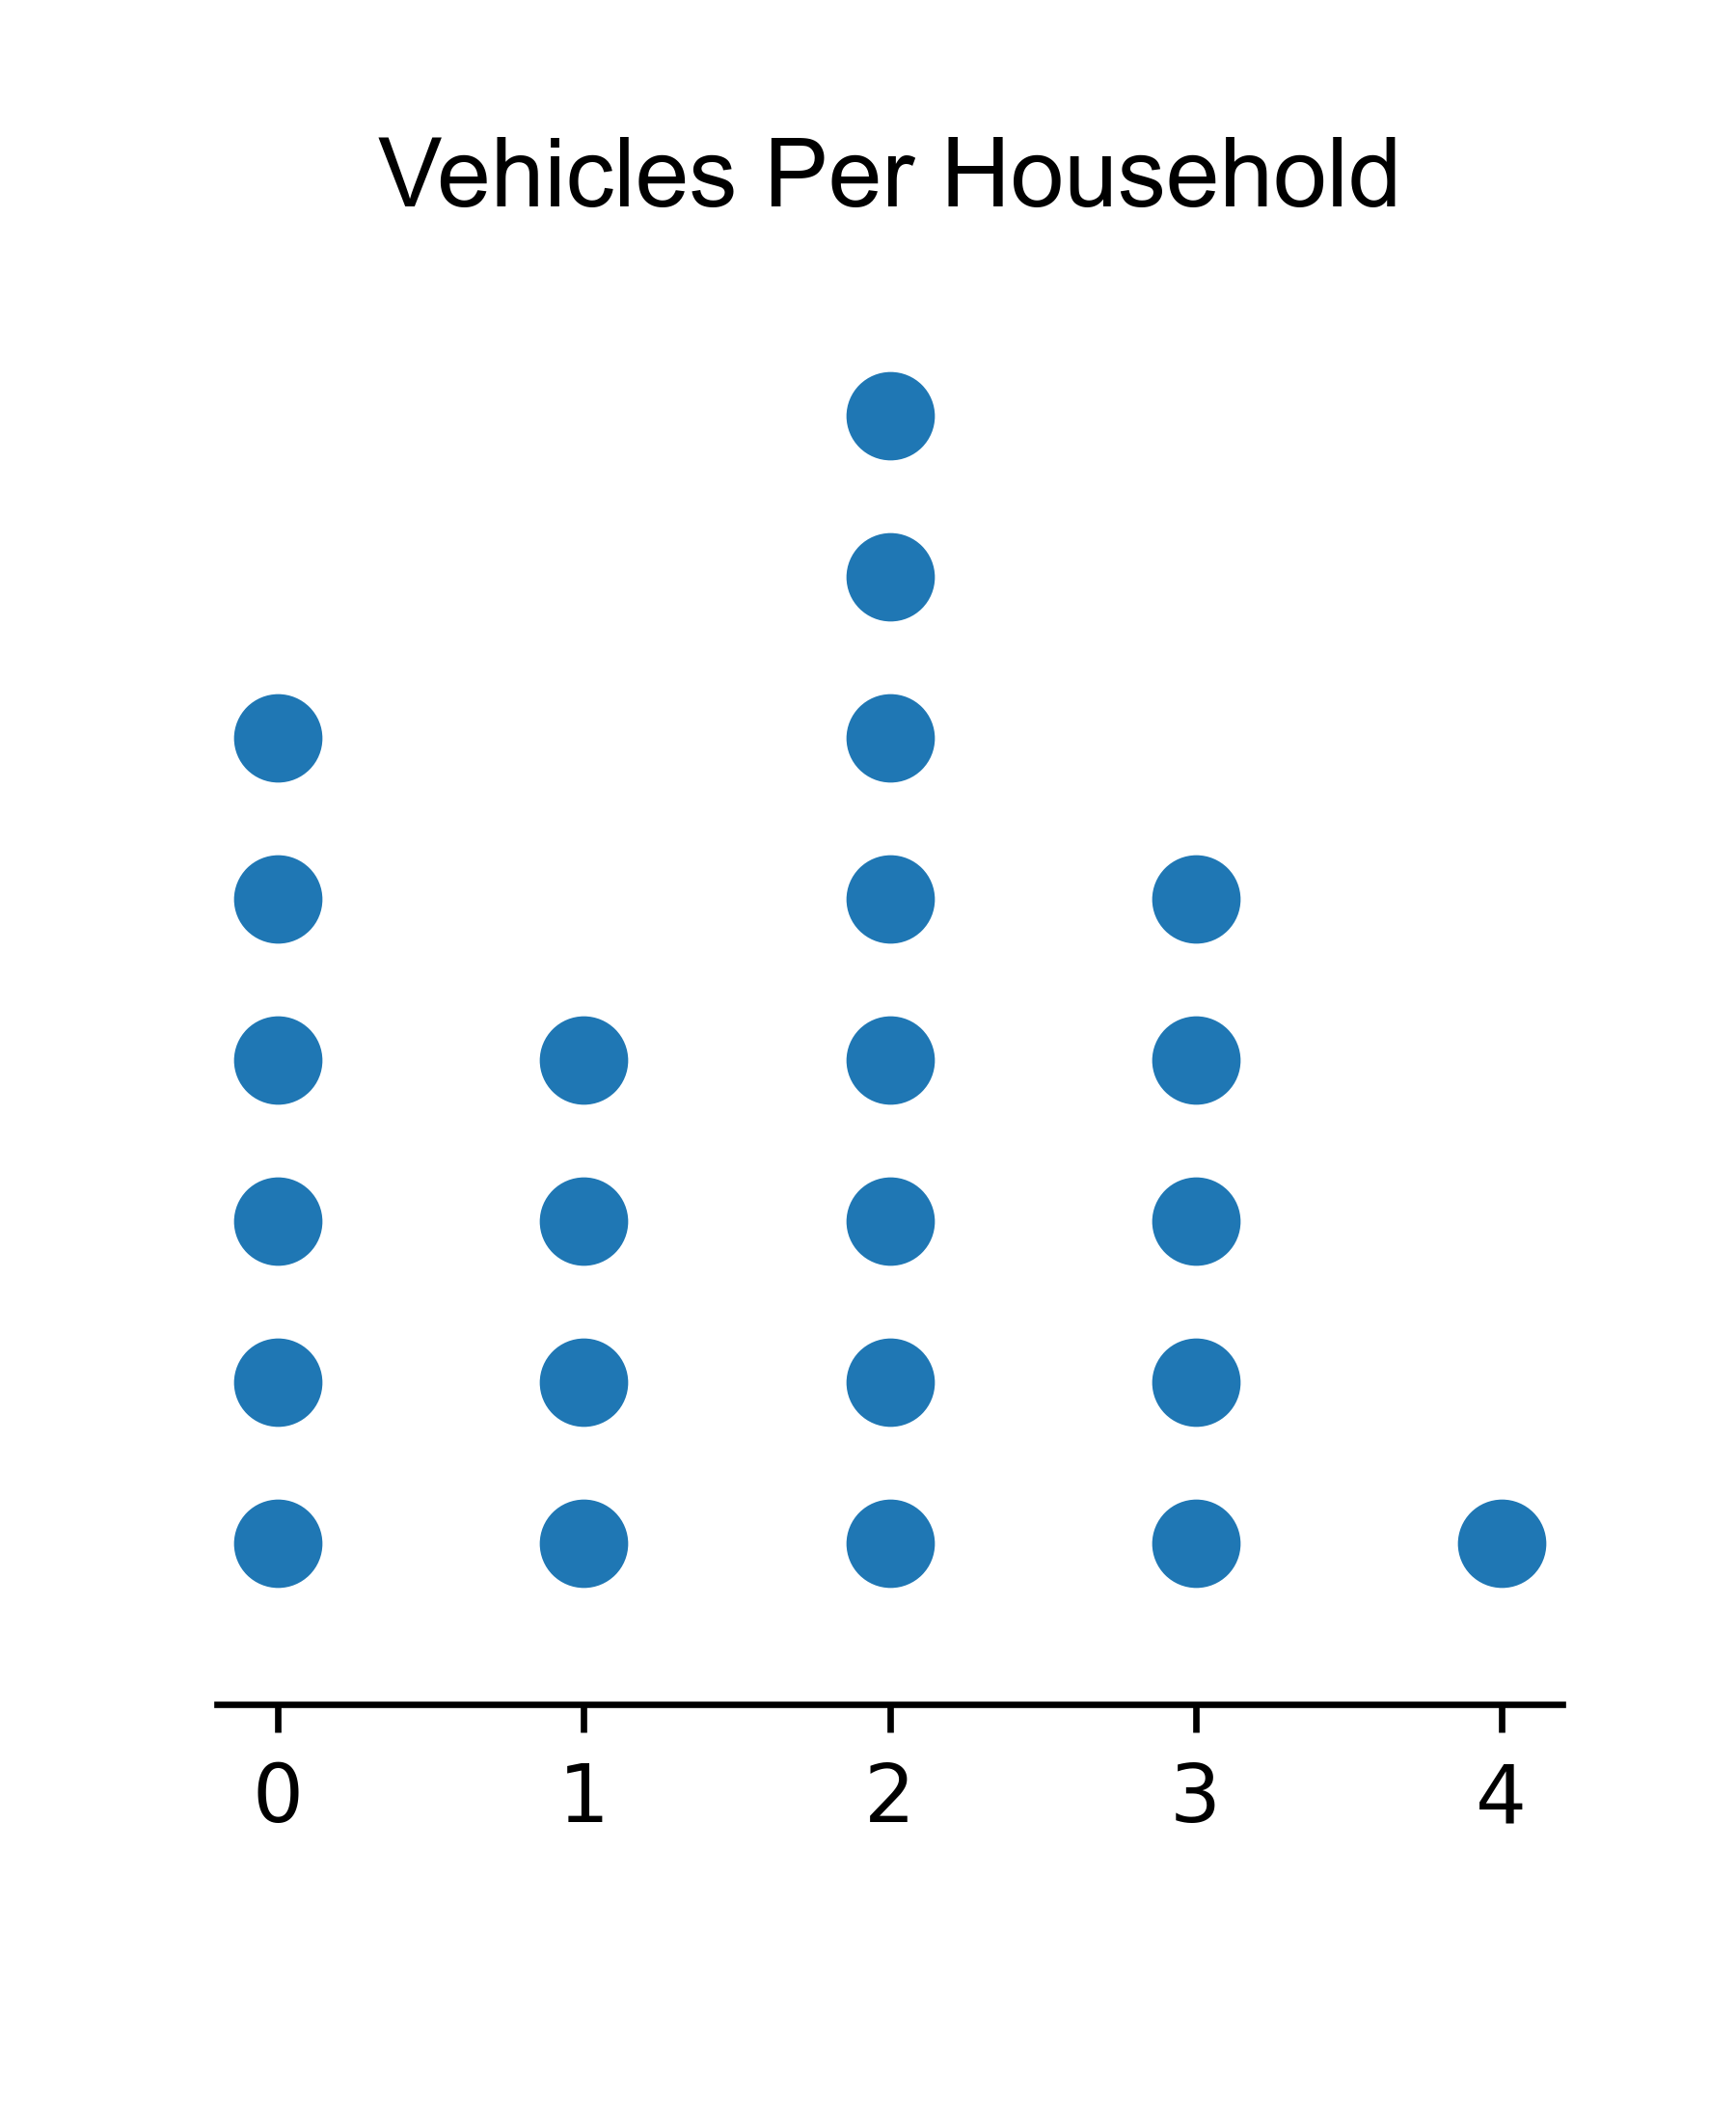
114def dot_vehicles():
115 data = [2, 0, 3, 2, 1, 0, 2, 3, 4, 2, 2, 1, 0, 1, 3, 2, 1, 0, 0, 0, 2, 2, 3, 3]
116 title = "vehicles per household"
117 dot_plot(data, title)
118
119
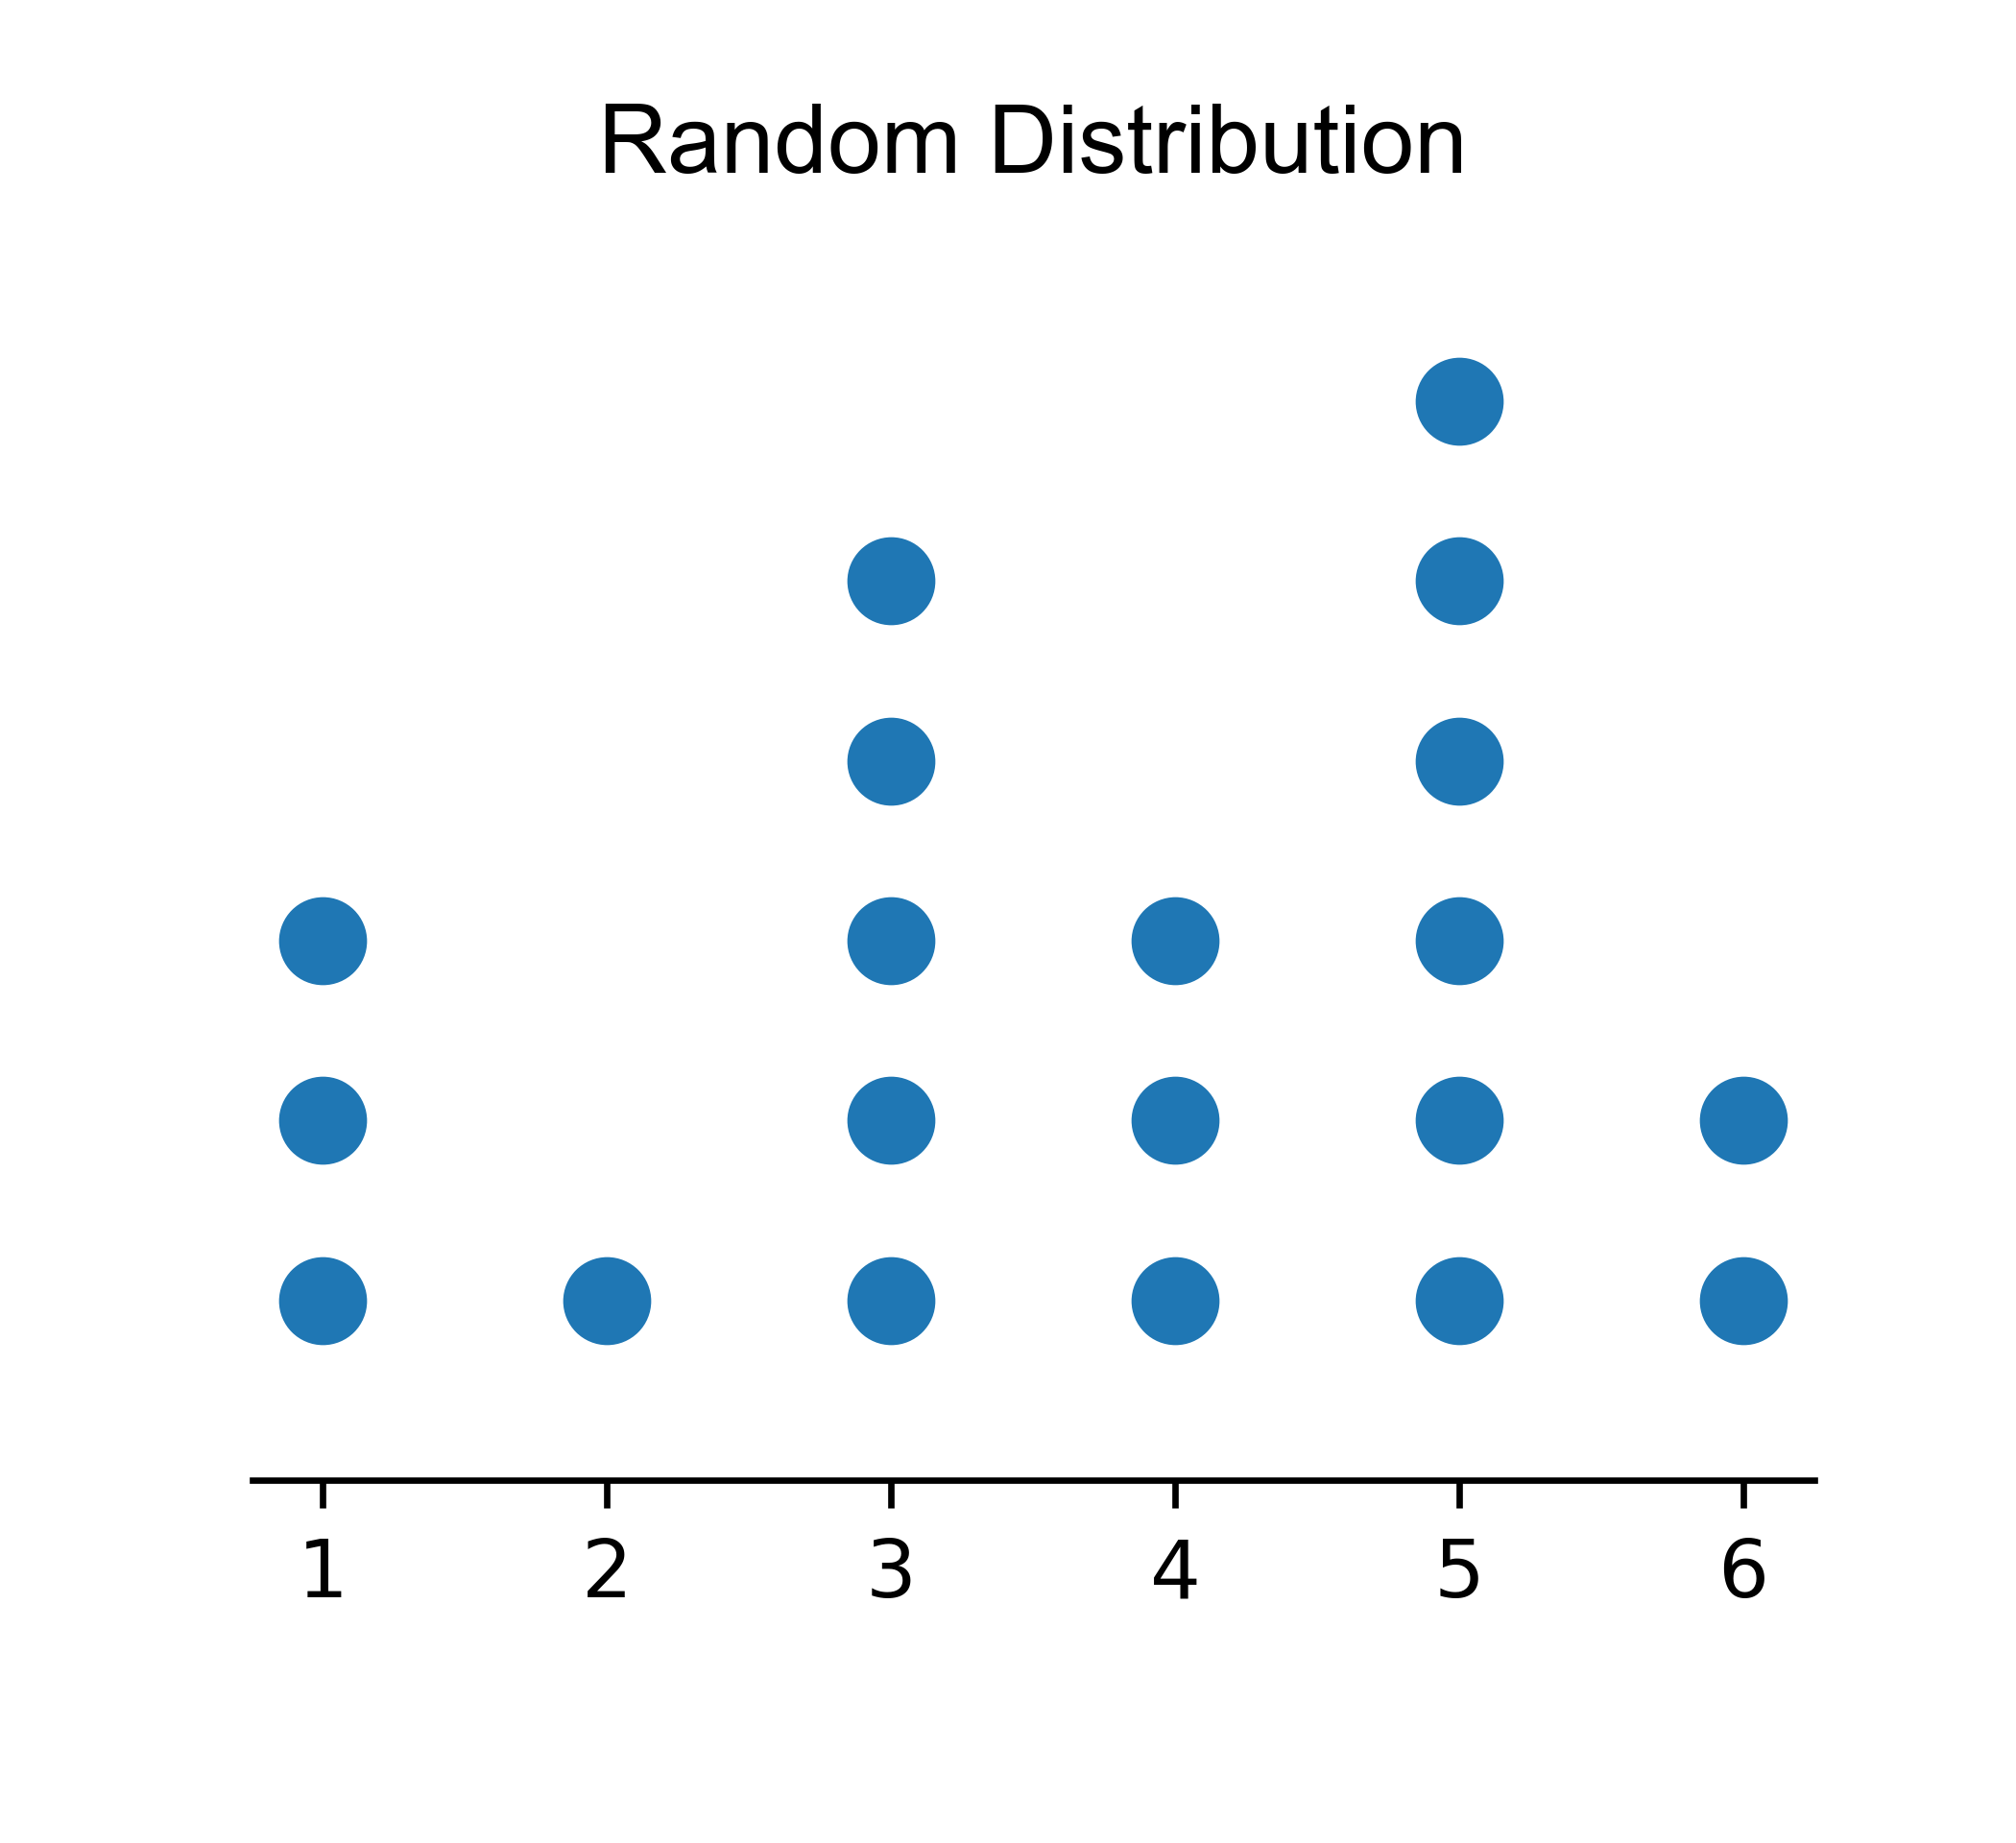
120def dot_random():
121 data = random_data(1, 6, 20)
122 title = "Random distribution"
123 dot_plot(data, title)
124
125
126def dot_normal():
127 data = norm_sample_data(5, 45, 25, 3, 50)
128 title = "Normal distribution"
129 dot_plot(data, title)
130
131
132# Call the main function if this file is run as a script
133if __name__ == "__main__":
134 dot_pets()
135 dot_vehicles()
136 dot_random()
137 dot_normal()