3. Matrix transformations
VC2M10A06: level 10: Implement algorithms that use data structures using pseudocode or a general purpose programming language
Using two-dimensional arrays such as matrices to represent and implement sequences of transformations of sets of points in the plane
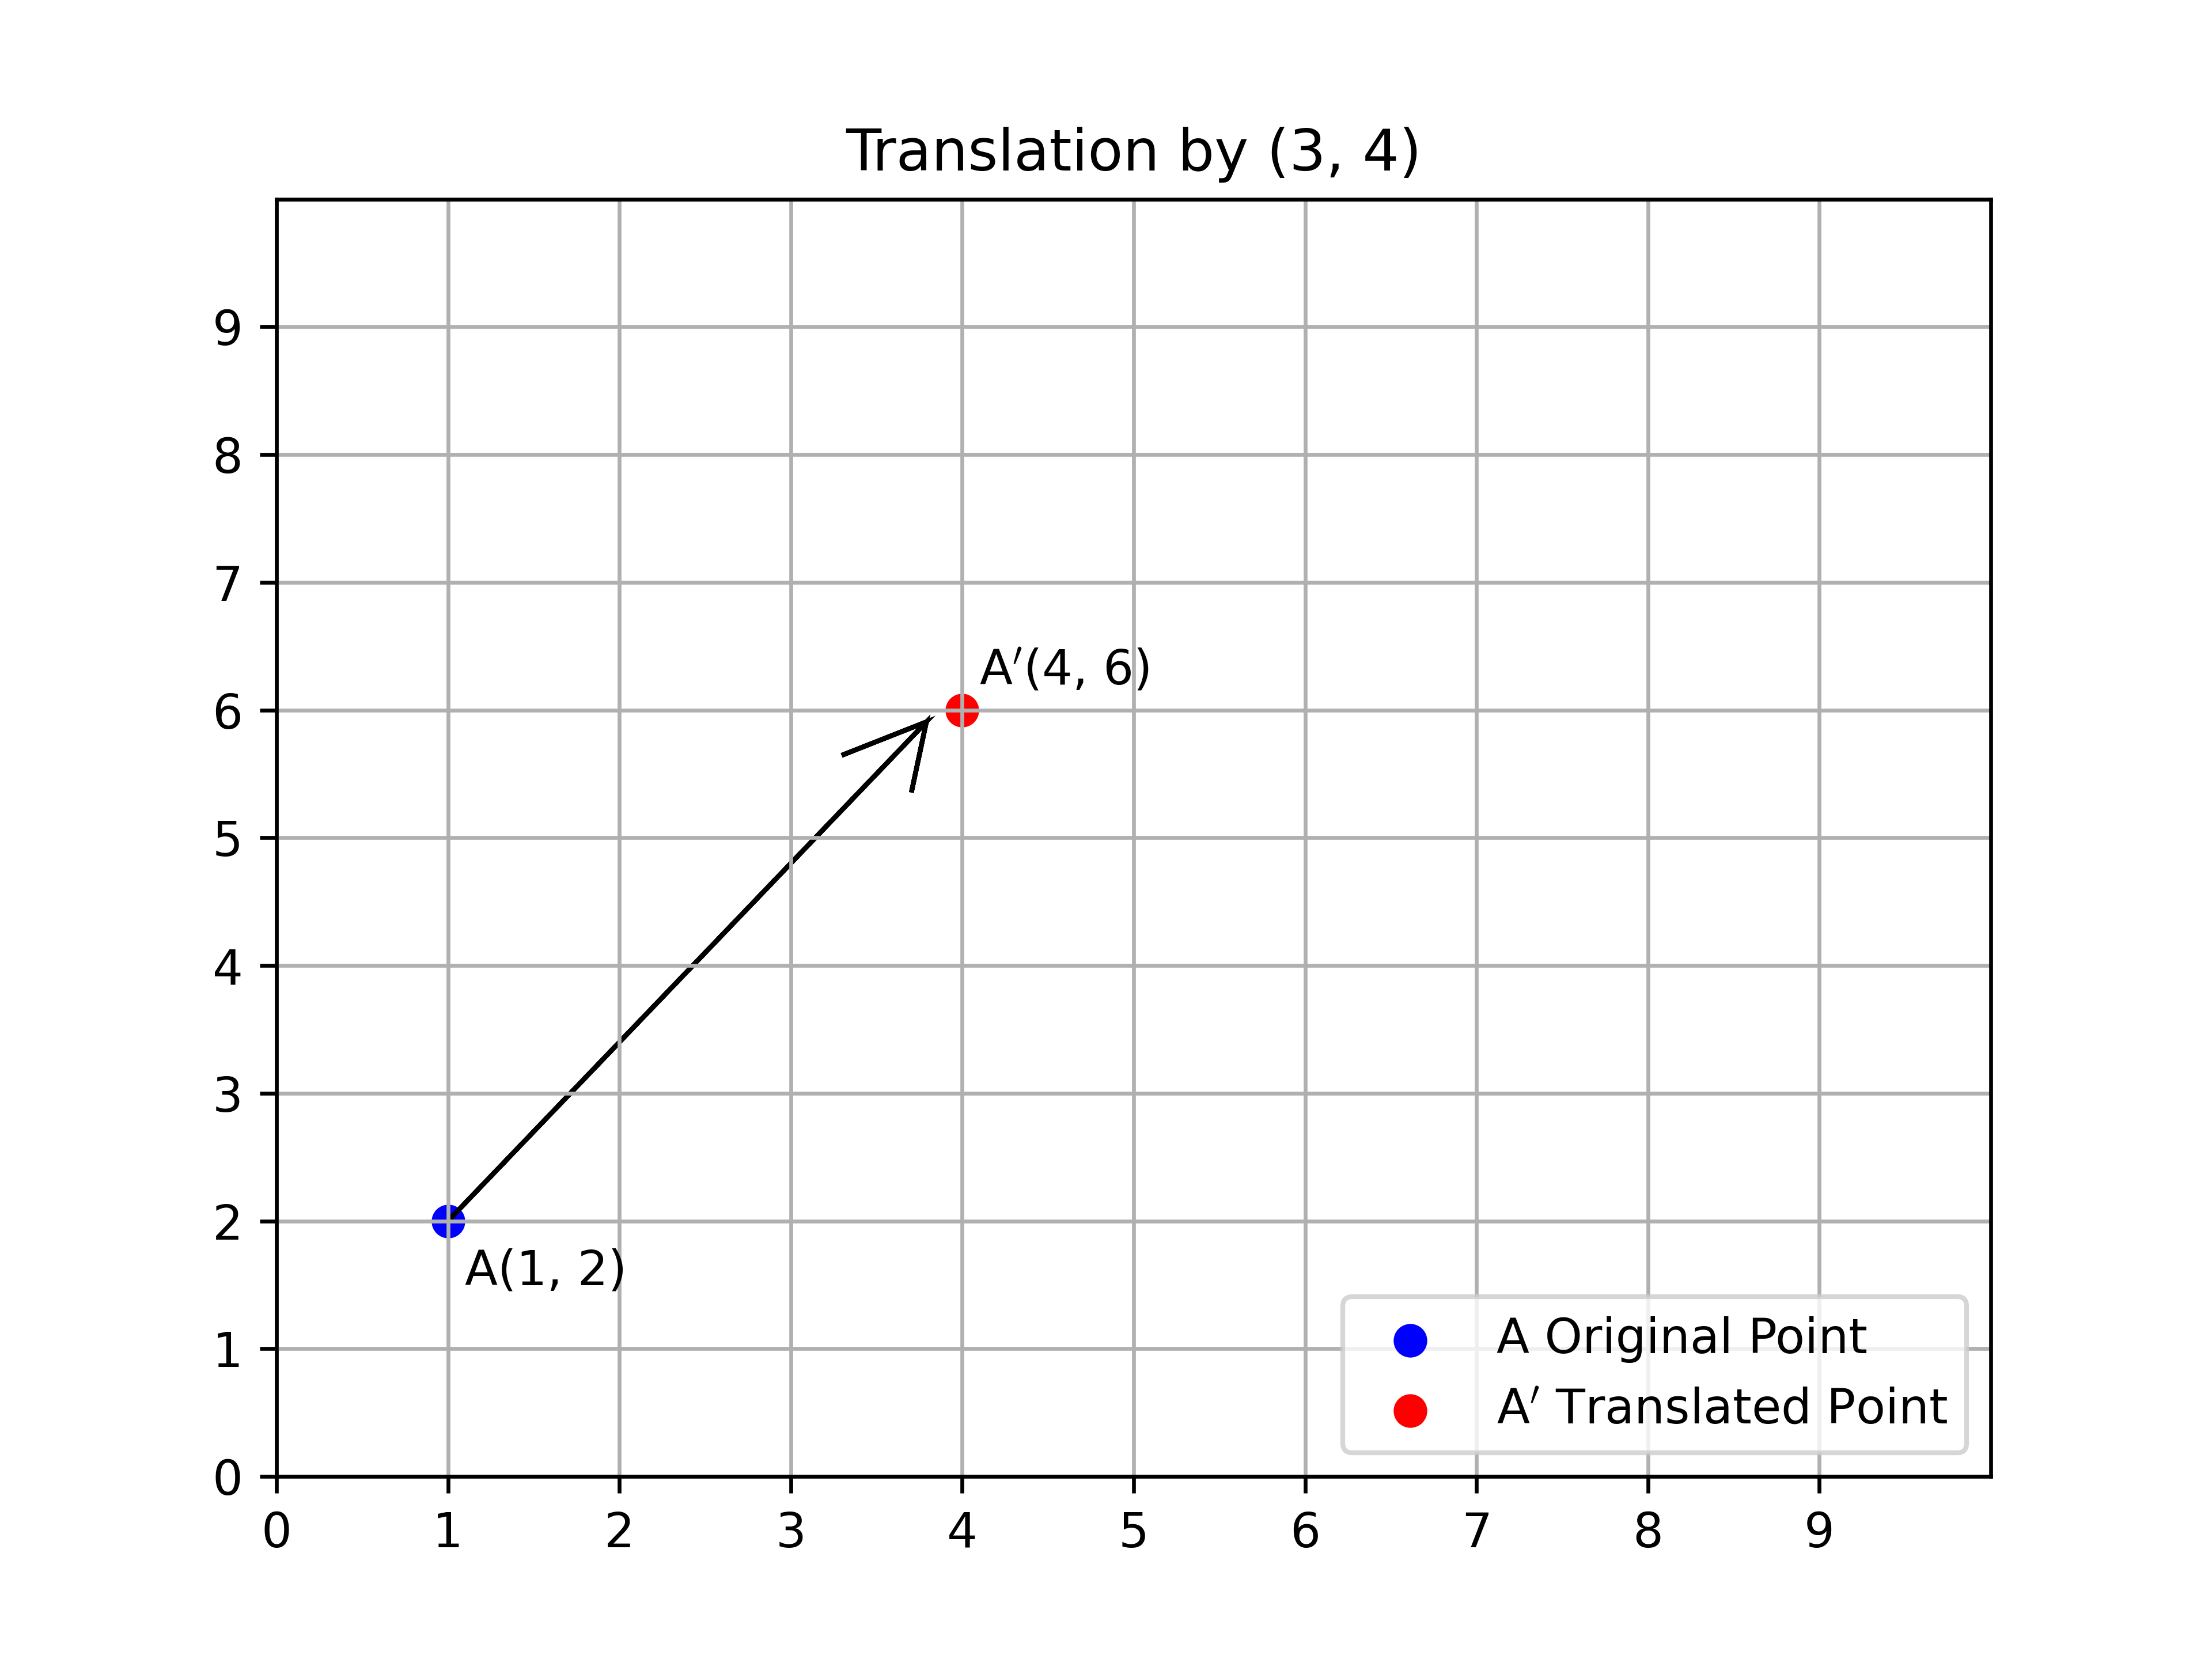
3.1. Translation
The translation is shown below.
Python code for a translation:
 1import numpy as np
 2import matplotlib.pyplot as plt
 3from matplotlib.ticker import MaxNLocator
 4from pathlib import Path
 5
 6currfile_dir = Path(__file__).parent
 7
 8
 9def plot_translation(point, translation, filename):
10    """
11    Plots the translation of a point by a given translation vector.
12
13    Args:
14        point (np.ndarray): The coordinates of the original point as a numpy array of shape (2,).
15        translation (np.ndarray): The translation vector as a numpy array of shape (2,).
16        filename (str): The filename to save the plot as.
17
18    Returns:
19        None
20    """
21    transformed_point = point + translation
22
23    ax = plt.figure().gca()
24    ax.xaxis.set_major_locator(MaxNLocator(integer=True))
25    ax.yaxis.set_major_locator(MaxNLocator(integer=True))
26    ax.set_xticks(np.arange(0, 10, 1))
27    ax.set_yticks(np.arange(0, 10, 1))
28
29    plt.scatter(point[0], point[1], color="blue", label="A Original Point")
30    plt.scatter(
31        transformed_point[0],
32        transformed_point[1],
33        color="red",
34        label="A$^\prime$ Translated Point",
35    )
36    plt.arrow(
37        point[0],
38        point[1],
39        transformed_point[0] - point[0] - 0.5,
40        transformed_point[1] - point[1] - 0.5,
41        head_width=0.5,
42        head_length=0.5,
43        overhang=1,
44    )
45    plt.xlim(0, 10)
46    plt.ylim(0, 10)
47    plt.legend(loc="lower right")
48    plt.annotate(r"A" + f"({point[0]}, {point[1]})", (point[0] + 0.1, point[1] - 0.5))
49    plt.text(
50        transformed_point[0] + 0.1,
51        transformed_point[1] + 0.2,
52        r"A$^\prime$" + f"({transformed_point[0]}, {transformed_point[1]})",
53    )
54    plt.title(f"Translation by ({translation[0]}, {translation[1]})")
55    plt.grid(True)
56    save_plot(plt, filename)
57    plt.show()
58
59
60def save_plot(plot, filename):
61    """
62    Saves the given plot to a file with the given filename within the curr directory.
63
64    Args:
65        plot (matplotlib.pyplot): The plot to save.
66        filename (str): The filename to save the plot as.
67    """
68    filepath = currfile_dir / filename
69    plot.savefig(filepath, dpi=600)
70
71
72point = np.array([1, 2])
73translation = np.array([3, 4])
74plot_translation(point, translation, "matrix_translation.png")
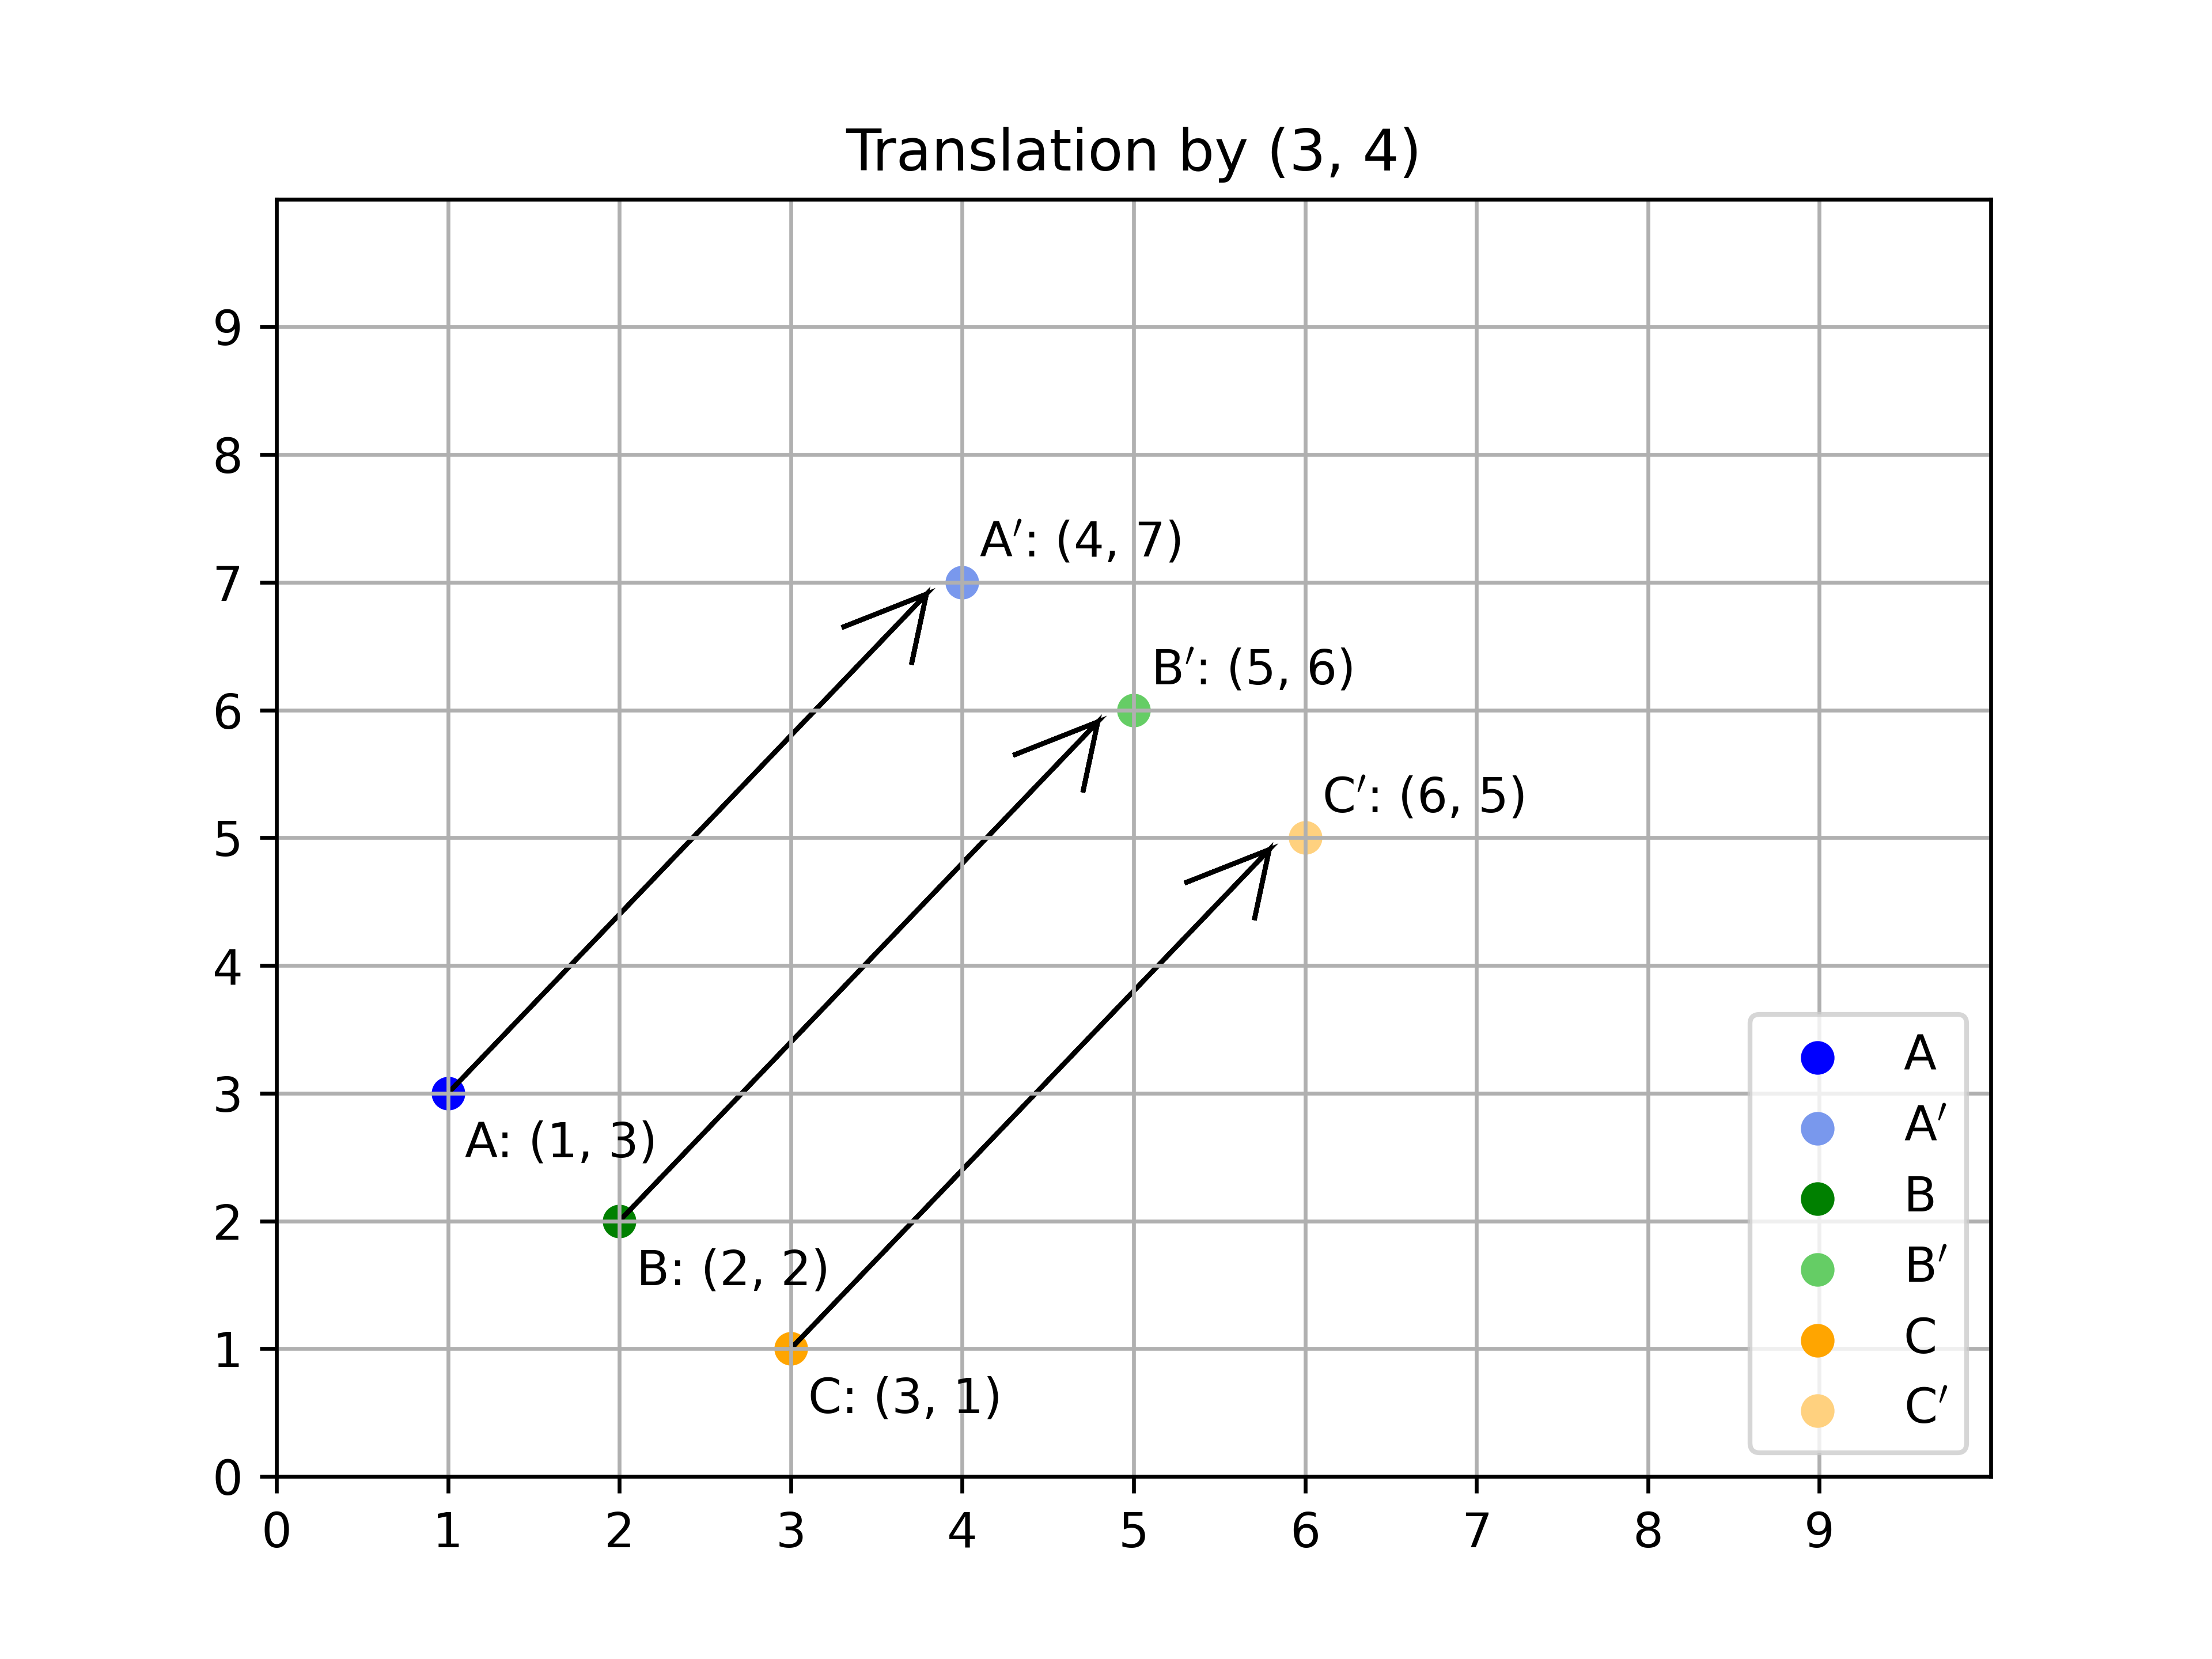
3.2. Translation of multiple points
The translation of multiple points is shown below.
Python code for a translation:
 1import numpy as np
 2import matplotlib.pyplot as plt
 3from matplotlib.ticker import MaxNLocator
 4from matplotlib.colors import to_rgba, LinearSegmentedColormap
 5from pathlib import Path
 6
 7currfile_dir = Path(__file__).parent
 8
 9def plot_translation(points, point_names, translation, filename):
10    """
11    Plots the translation of a list of points by a given translation vector.
12
13    Args:
14        points (List[np.ndarray]): A list of points, where each point is represented as a numpy array of shape (2,).
15        point_names (List[str]): A list of point names, where each name corresponds to a point in the `points` list.
16        translation (np.ndarray): The translation vector as a numpy array of shape (2,).
17        filename (str): The filename to save the plot as.
18
19    Returns:
20        None
21    """
22    colors = ['blue', 'green', 'orange', 'purple', 'brown']
23    light_colors = ['lightblue', 'lightgreen', 'moccasin', 'thistle', 'burlywood']
24    intermediate_colors = [LinearSegmentedColormap.from_list('', [to_rgba(colors[i]), to_rgba(light_colors[i])])(0.7) for i in range(len(colors))]
25
26    ax = plt.figure().gca()
27    ax.xaxis.set_major_locator(MaxNLocator(integer=True))
28    ax.yaxis.set_major_locator(MaxNLocator(integer=True))
29    ax.set_xticks(np.arange(0, 10, 1))
30    ax.set_yticks(np.arange(0, 10, 1))
31
32    for i, (point, point_name) in enumerate(zip(points, point_names)):
33        transformed_point = point + translation
34        plt.scatter(point[0], point[1], color=colors[i % len(colors)], label=f'{point_name}')
35        plt.scatter(transformed_point[0], transformed_point[1], color=intermediate_colors[i % len(intermediate_colors)], label=f'{point_name}$^\prime$')
36        plt.arrow(point[0], point[1], transformed_point[0]-point[0]-0.5, transformed_point[1]-point[1]-0.5, head_width=0.5, head_length=0.5, overhang=1)
37        plt.annotate(f'{point_name}: ({point[0]}, {point[1]})', (point[0]+0.1, point[1]-0.5))
38        plt.text(transformed_point[0]+0.1, transformed_point[1]+0.2, f'{point_name}$^\prime$: ({transformed_point[0]}, {transformed_point[1]})')
39
40    plt.xlim(0, 10)
41    plt.ylim(0, 10)
42    plt.legend(loc='lower right')
43    plt.title(f'Translation by ({translation[0]}, {translation[1]})')
44    plt.grid(True)
45    save_plot(plt, filename)
46    plt.show()
47
48def save_plot(plot, filename):
49    """
50    Saves the given plot to a file with the given filename within the curr directory
51    """
52    filepath = currfile_dir / filename
53    plot.savefig(filepath, dpi=600)
54
55points = [np.array([1, 3]), np.array([2, 2]), np.array([3, 1])]
56point_names = ['A', 'B', 'C']
57translation = np.array([3, 4])
58plot_translation(points, point_names, translation, "matrix_translation_multiple_points.png")
3.3. Transformations
Python code for a matrix transformation:
1import numpy as np
2import matplotlib.pyplot as plt
3from matplotlib.ticker import MaxNLocator
4from matplotlib.colors import to_rgba, LinearSegmentedColormap
5from pathlib import Path
6
7currfile_dir = Path(__file__).parent
8
9
10def plot_transformation(points, point_names, matrix_reflection, filename):
11 """
12 Plots the reflection of a list of points about the x-axis or y-axis.
13
14 Args:
15 points (List[np.ndarray]): A list of points, where each point is represented as a numpy array of shape (2,).
16 point_names (List[str]): A list of point names, where each name corresponds to a point in the `points` list.
17 matrix_reflection (np.ndarray): The reflection matrix to use for reflecting the points. Must be a numpy array of shape (2, 2).
18 filename (str): The filename to save the plot as.
19
20 Returns:
21 None
22 """
23 colors = ["blue", "green", "brown", "purple", "orange"]
24 light_colors = ["lightblue", "lightgreen", "burlywood", "thistle", "moccasin"]
25 intermediate_colors = [
26 LinearSegmentedColormap.from_list(
27 "", [to_rgba(colors[i]), to_rgba(light_colors[i])]
28 )(0.7)
29 for i in range(len(colors))
30 ]
31 ax = plt.figure().gca()
32 ax.xaxis.set_major_locator(MaxNLocator(integer=True))
33 ax.yaxis.set_major_locator(MaxNLocator(integer=True))
34 ax.set_xticks(np.arange(-10, 10, 1))
35 ax.set_yticks(np.arange(-10, 10, 1))
36 for i, (point, point_name) in enumerate(zip(points, point_names)):
37 transformed_point = matrix_reflection.dot(point)
38 plt.annotate(
39 f"{point_name} ({point[0]}, {point[1]})",
40 (point[0] + 0.2, point[1] + 0.2),
41 )
42 plt.text(
43 transformed_point[0] + 0.2,
44 transformed_point[1] + 0.2,
45 f"{point_name}$^\prime$ ({transformed_point[0]}, {transformed_point[1]})",
46 )
47 plt.scatter(
48 point[0], point[1], color=colors[i % len(colors)], label=f"{point_name}"
49 )
50 plt.scatter(
51 transformed_point[0],
52 transformed_point[1],
53 color=intermediate_colors[i % len(intermediate_colors)],
54 label=f"{point_name}$^\prime$",
55 )
56 # Shorten the arrows
57 dx = transformed_point[0] - point[0]
58 dy = transformed_point[1] - point[1]
59 # dx -= np.sign(dx) * 0.8
60 # dy -= np.sign(dy) * 0.8
61 # Reduce the line length by 0.8
62 if dx == 0:
63 dy -= np.sign(dy) * 0.8
64 elif dy == 0:
65 dx -= np.sign(dx) * 0.8
66 else:
67 gradient = abs(dy / dx)
68 dx -= np.sign(dx) * 0.8 / np.sqrt(1 + gradient**2)
69 dy -= np.sign(dy) * 0.8 * gradient / np.sqrt(1 + gradient**2)
70
71
72 plt.arrow(
73 point[0],point[1],dx,dy,head_width=0.5,head_length=0.5,overhang=1,
74 color=colors[i % len(colors)],
75 )
76 plt.xlim(-10, 10)
77 plt.ylim(-10, 10)
78 plt.legend(bbox_to_anchor=(1.05, 0.5), loc="upper left")
79 plt.legend(loc='center left', bbox_to_anchor=(1.05, 0.5))
80 plt.subplots_adjust(right=0.8)
81
82 title_str = f"Transformation by {np.array2string(matrix_reflection, separator=', ', prefix='[', suffix=']', max_line_width=np.inf)}".replace("\n", "")
83 plt.title(title_str)
84 # Change grid lines to be dotted except for the grid lines going through the origin
85 ax.grid(True, which="both", linestyle="--")
86 # Make the axis lines grey instead of black
87 ax.axhline(y=0, color="grey")
88 ax.axvline(x=0, color="grey")
89 save_plot(plt, filename)
90 # plt.show()
91
92
93def save_plot(plot, filename):
94 " Saves the given plot to a file with the given filename within the curr directory"
95 filepath = currfile_dir / filename
96 plot.savefig(filepath, dpi=600)
97
98
99points = [np.array([4, 6]), np.array([-2, -4])] # , np.array([-2, -2]), np.array([-3, 2])
100point_names = ["A", "B"] # , "C", "D"
101# Define reflection matrices for reflecting about x-axis and y-axis
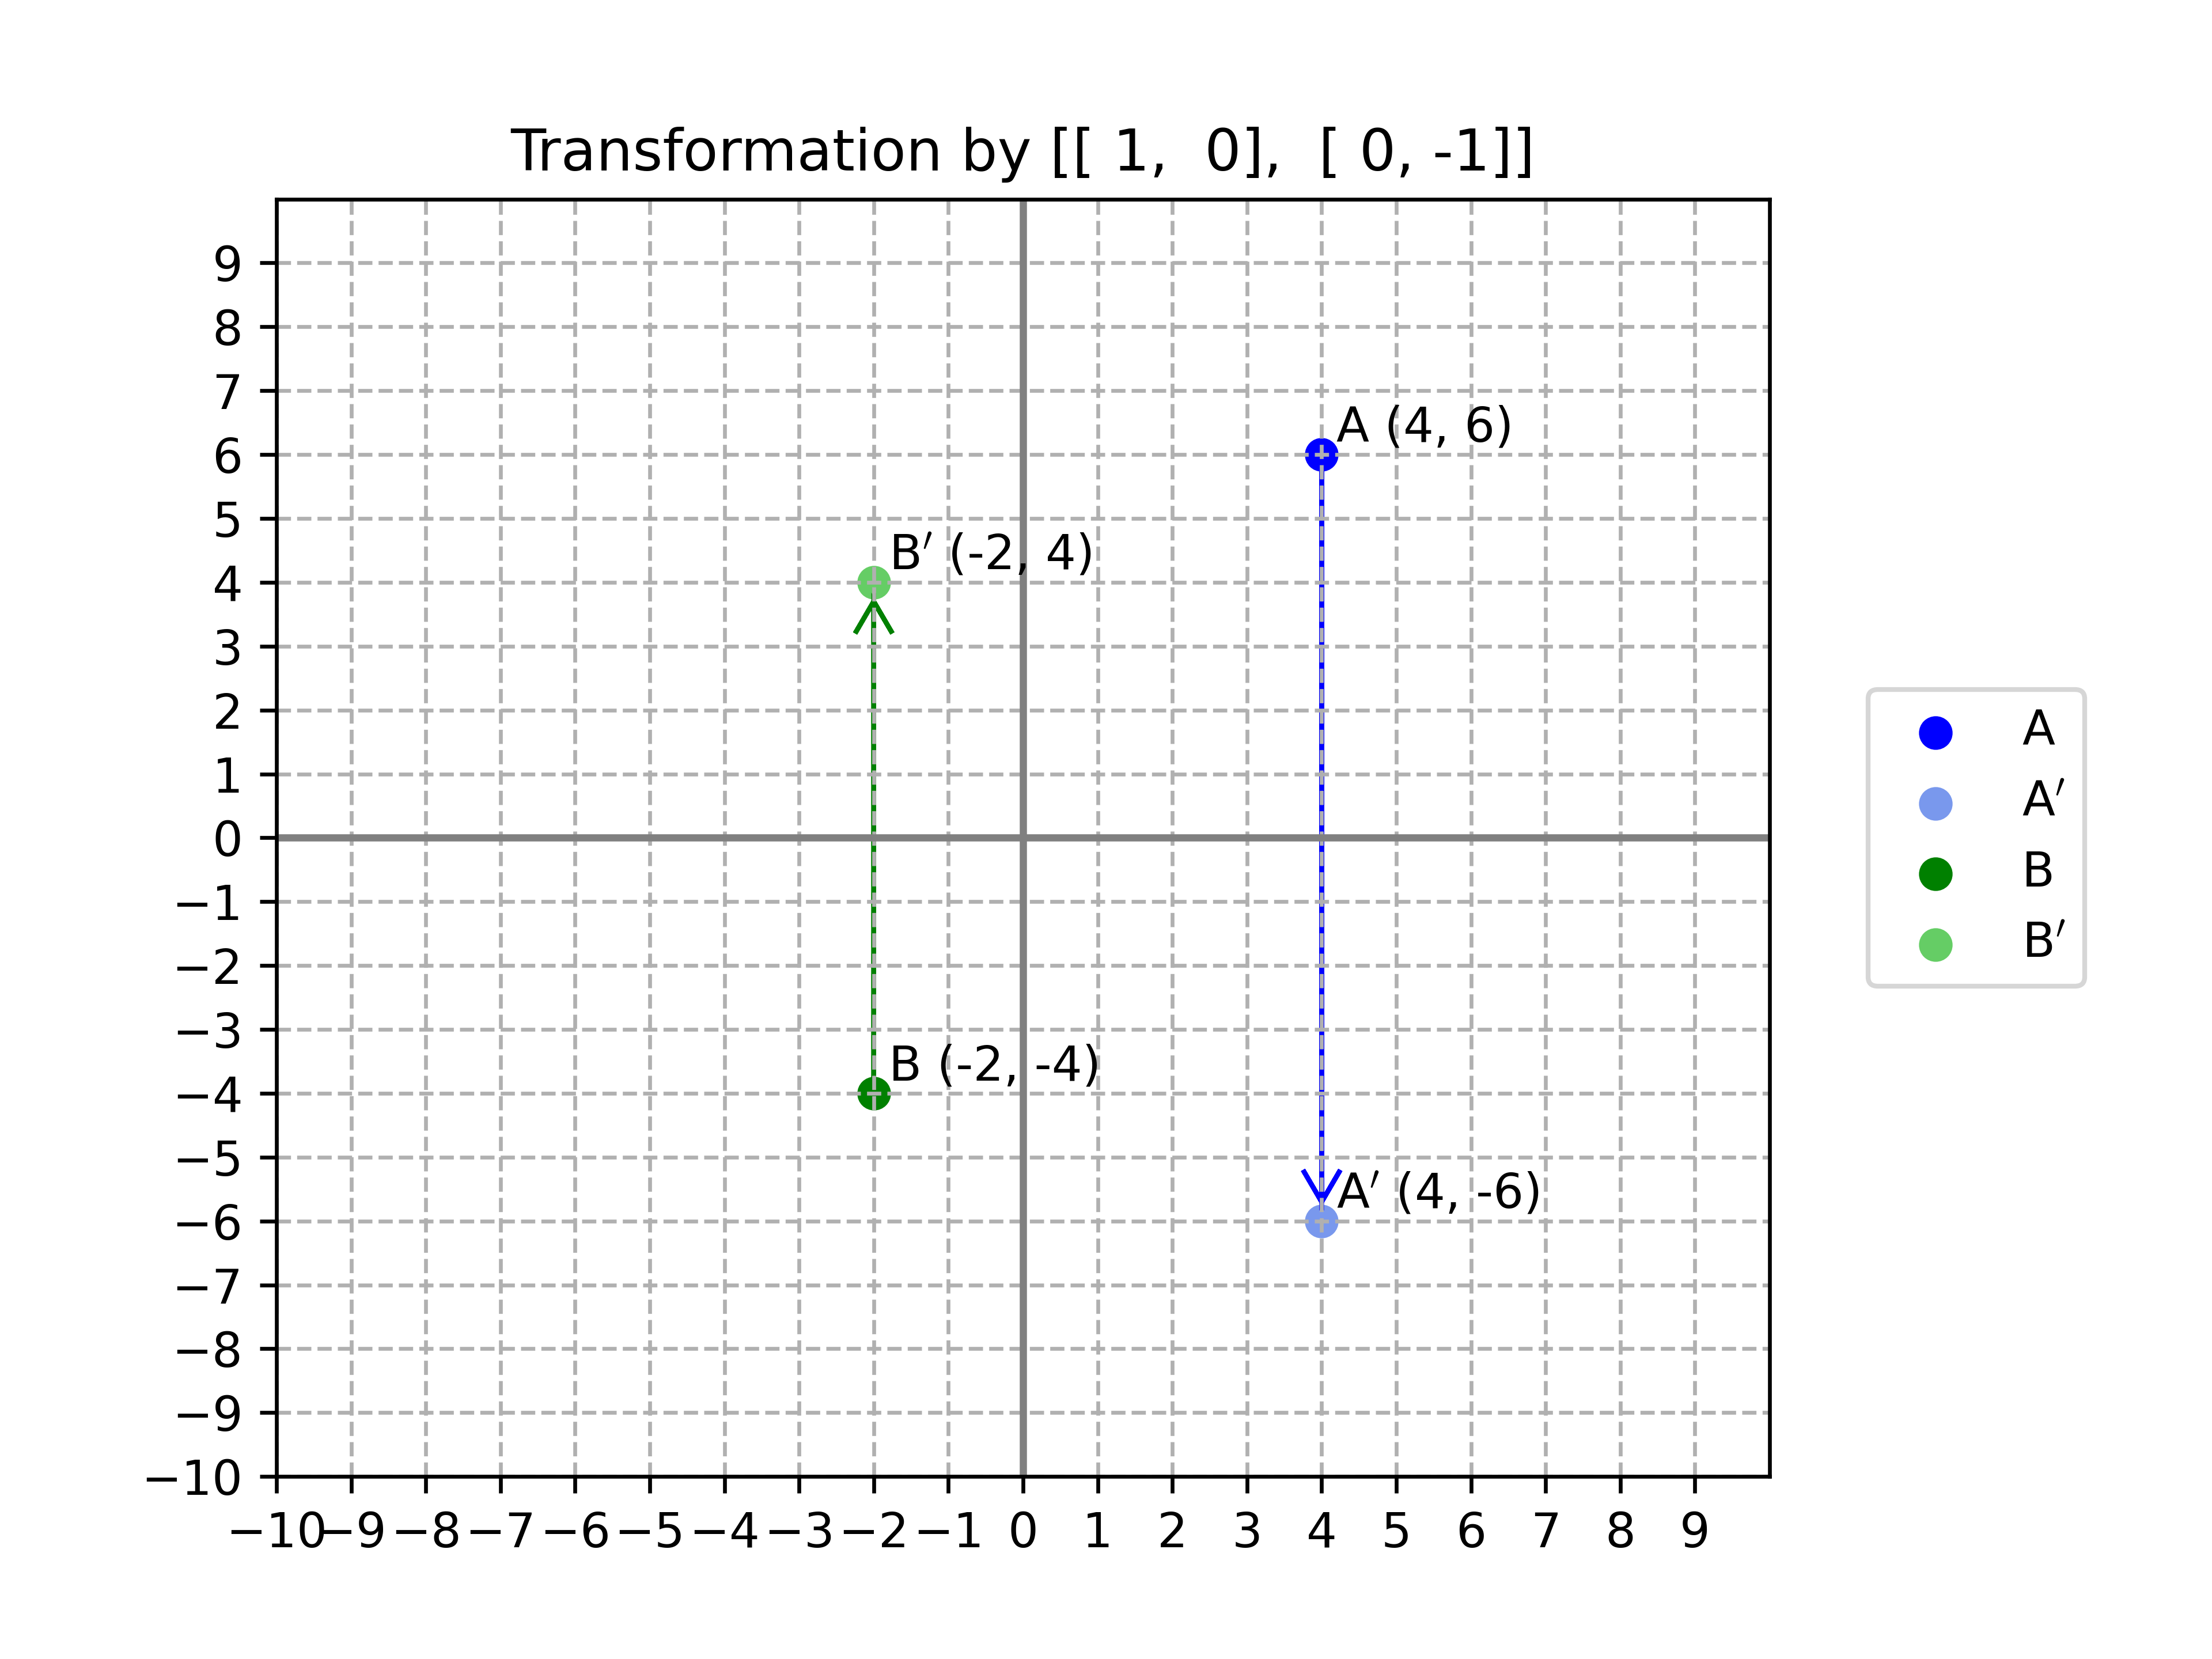
102matrix_reflection_x = np.array([[1, 0], [0, -1]])
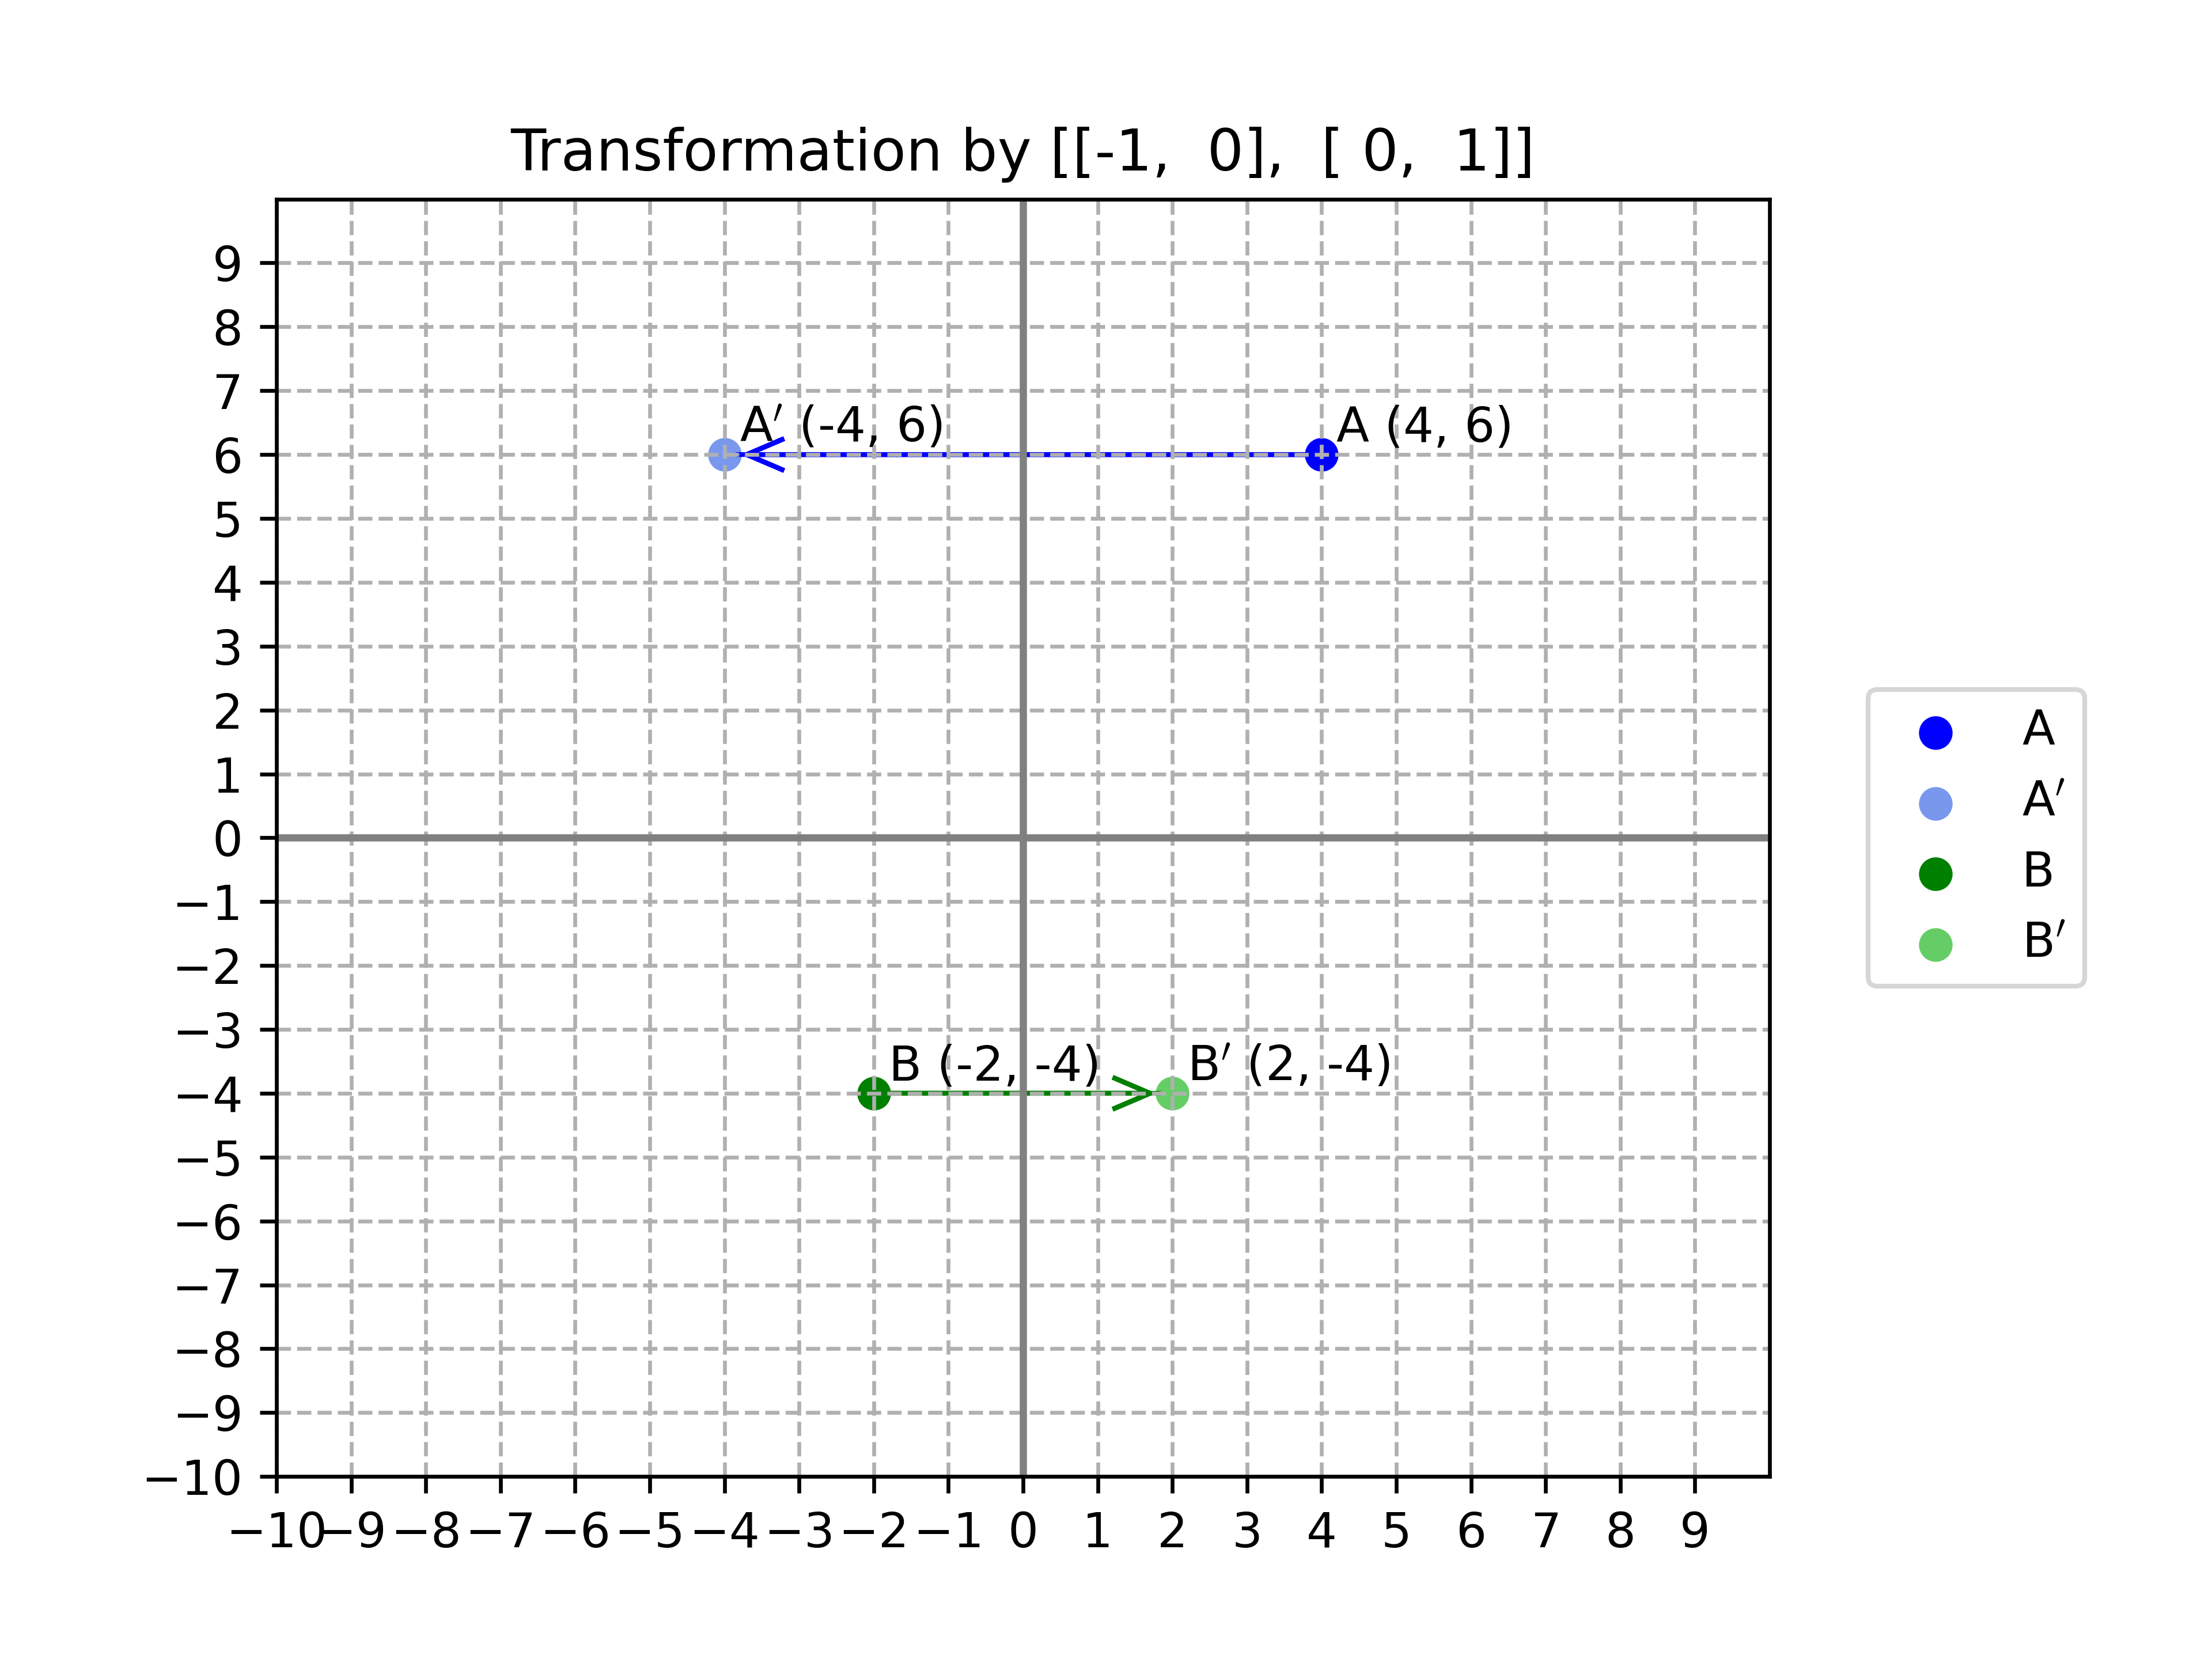
103matrix_reflection_y = np.array([[-1, 0], [0, 1]])
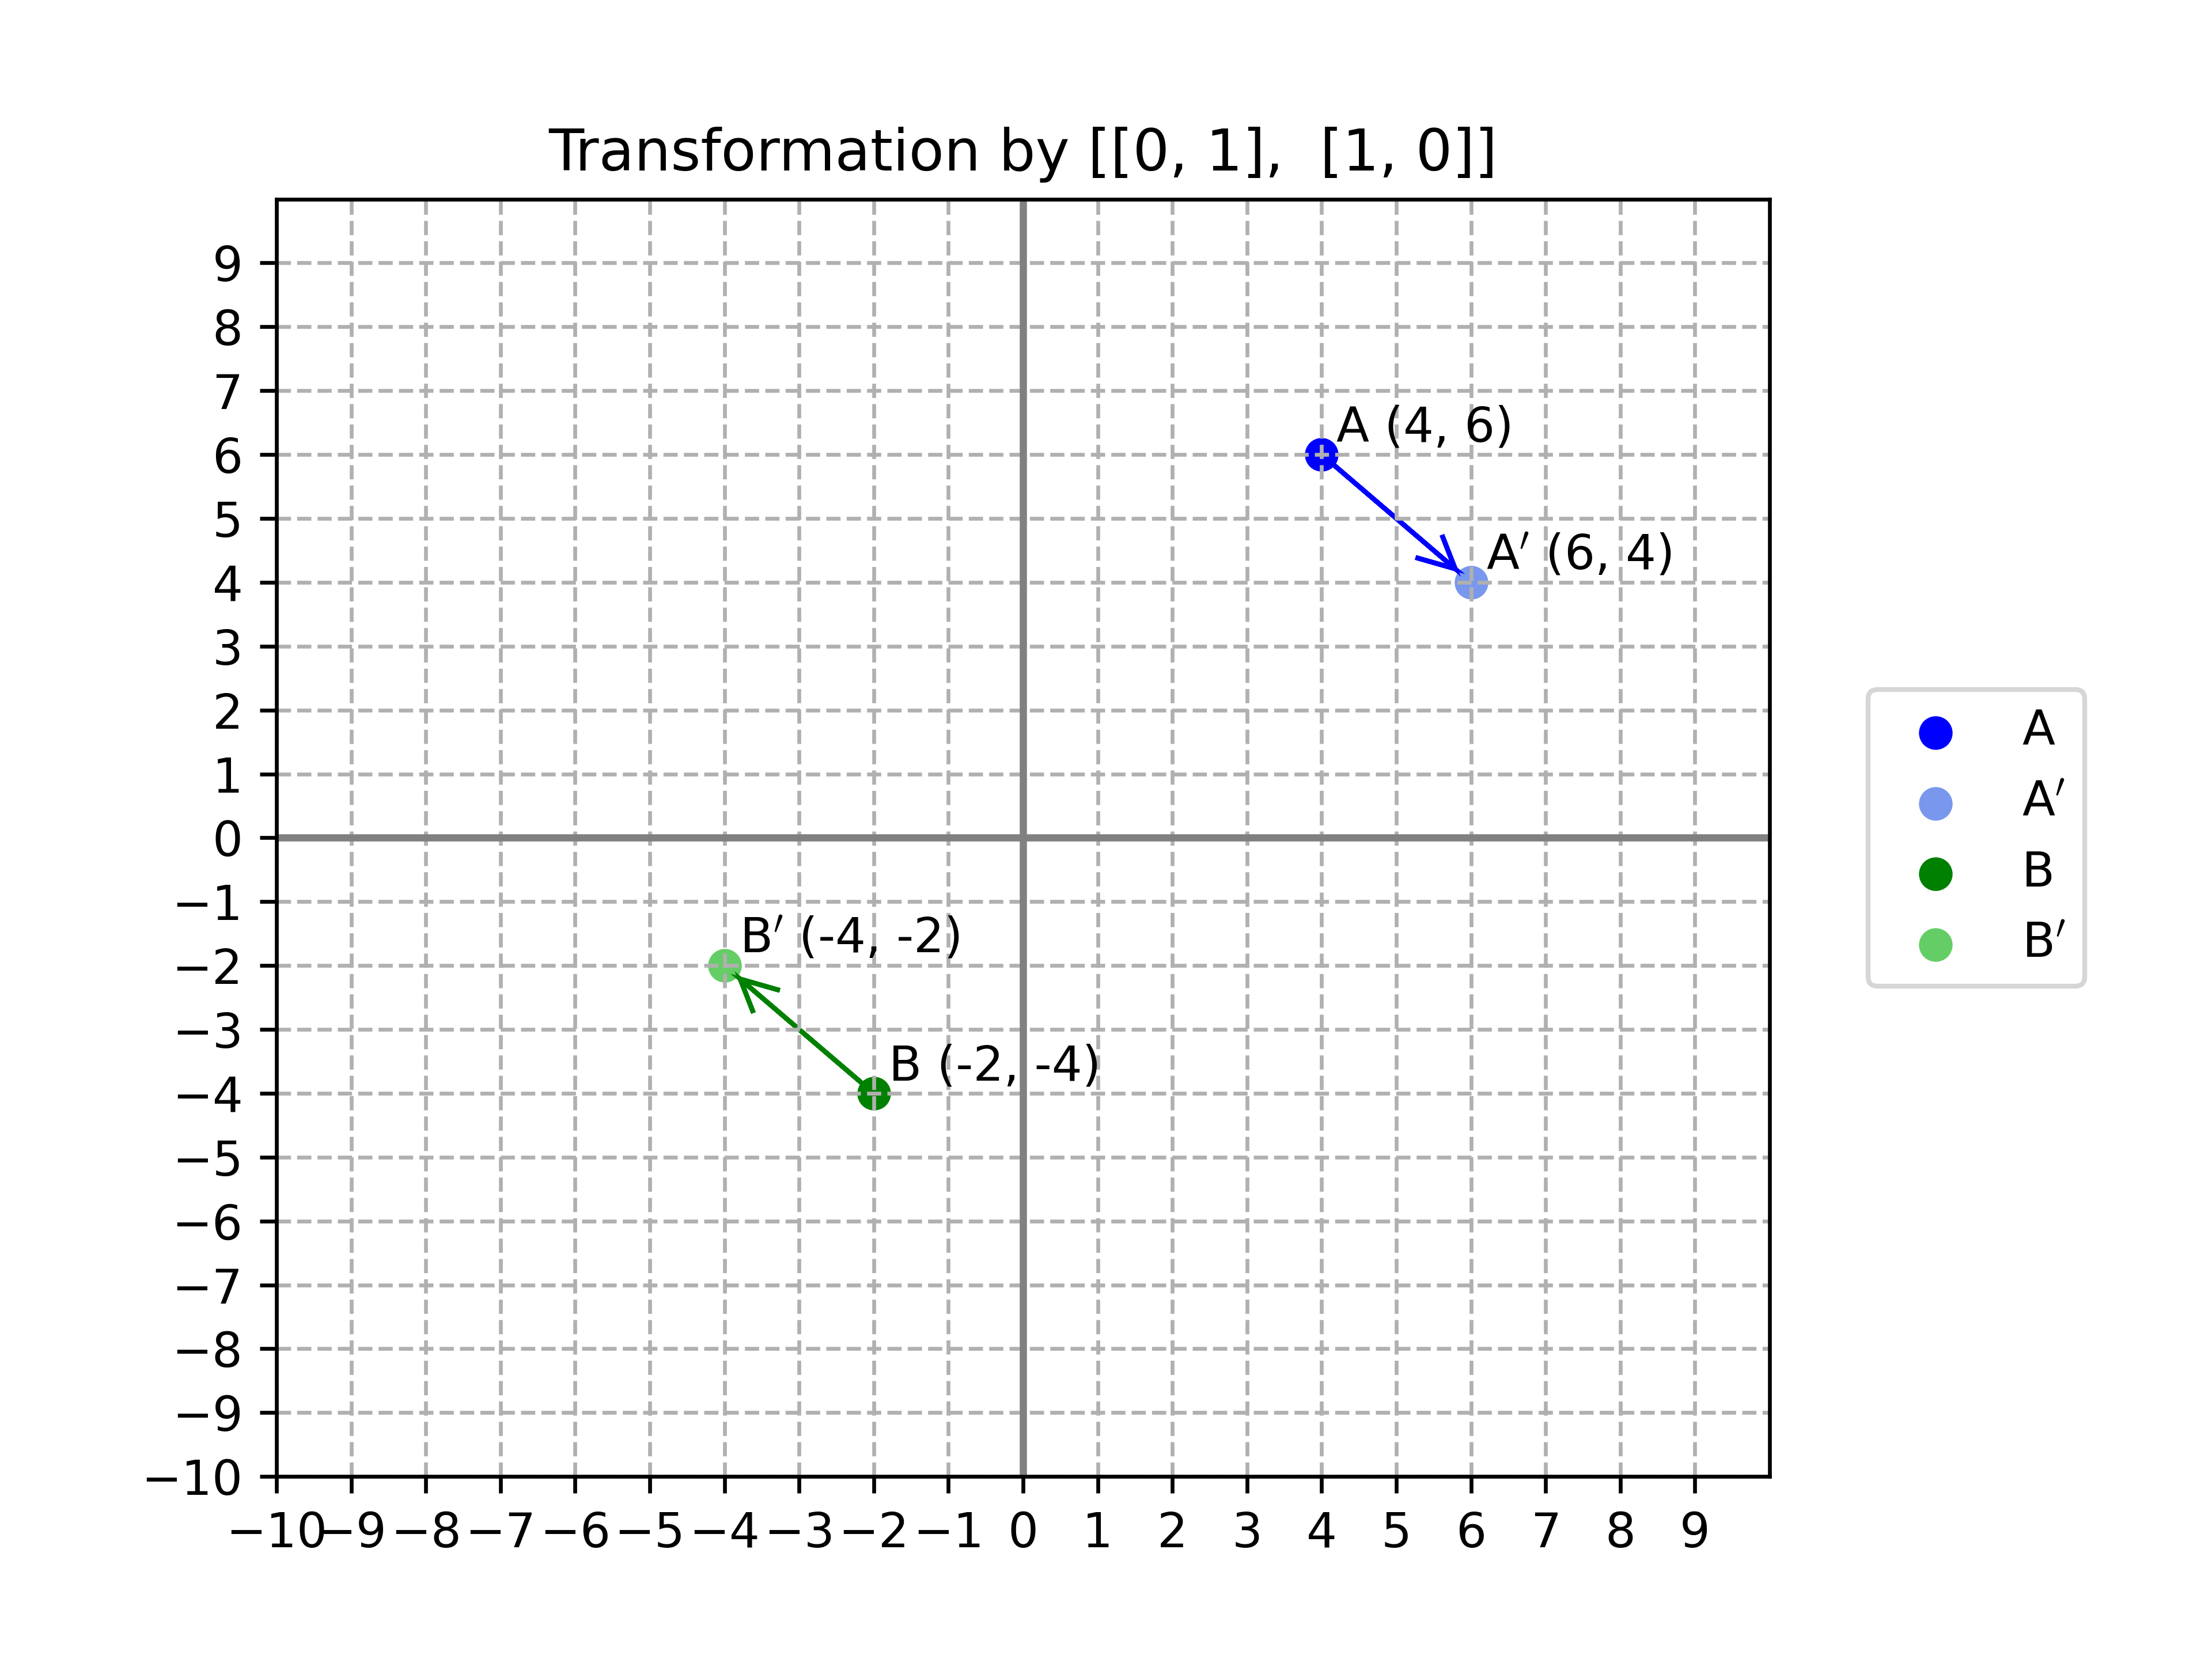
104matrix_reflection_yisx = np.array([[0, 1], [1, 0]])
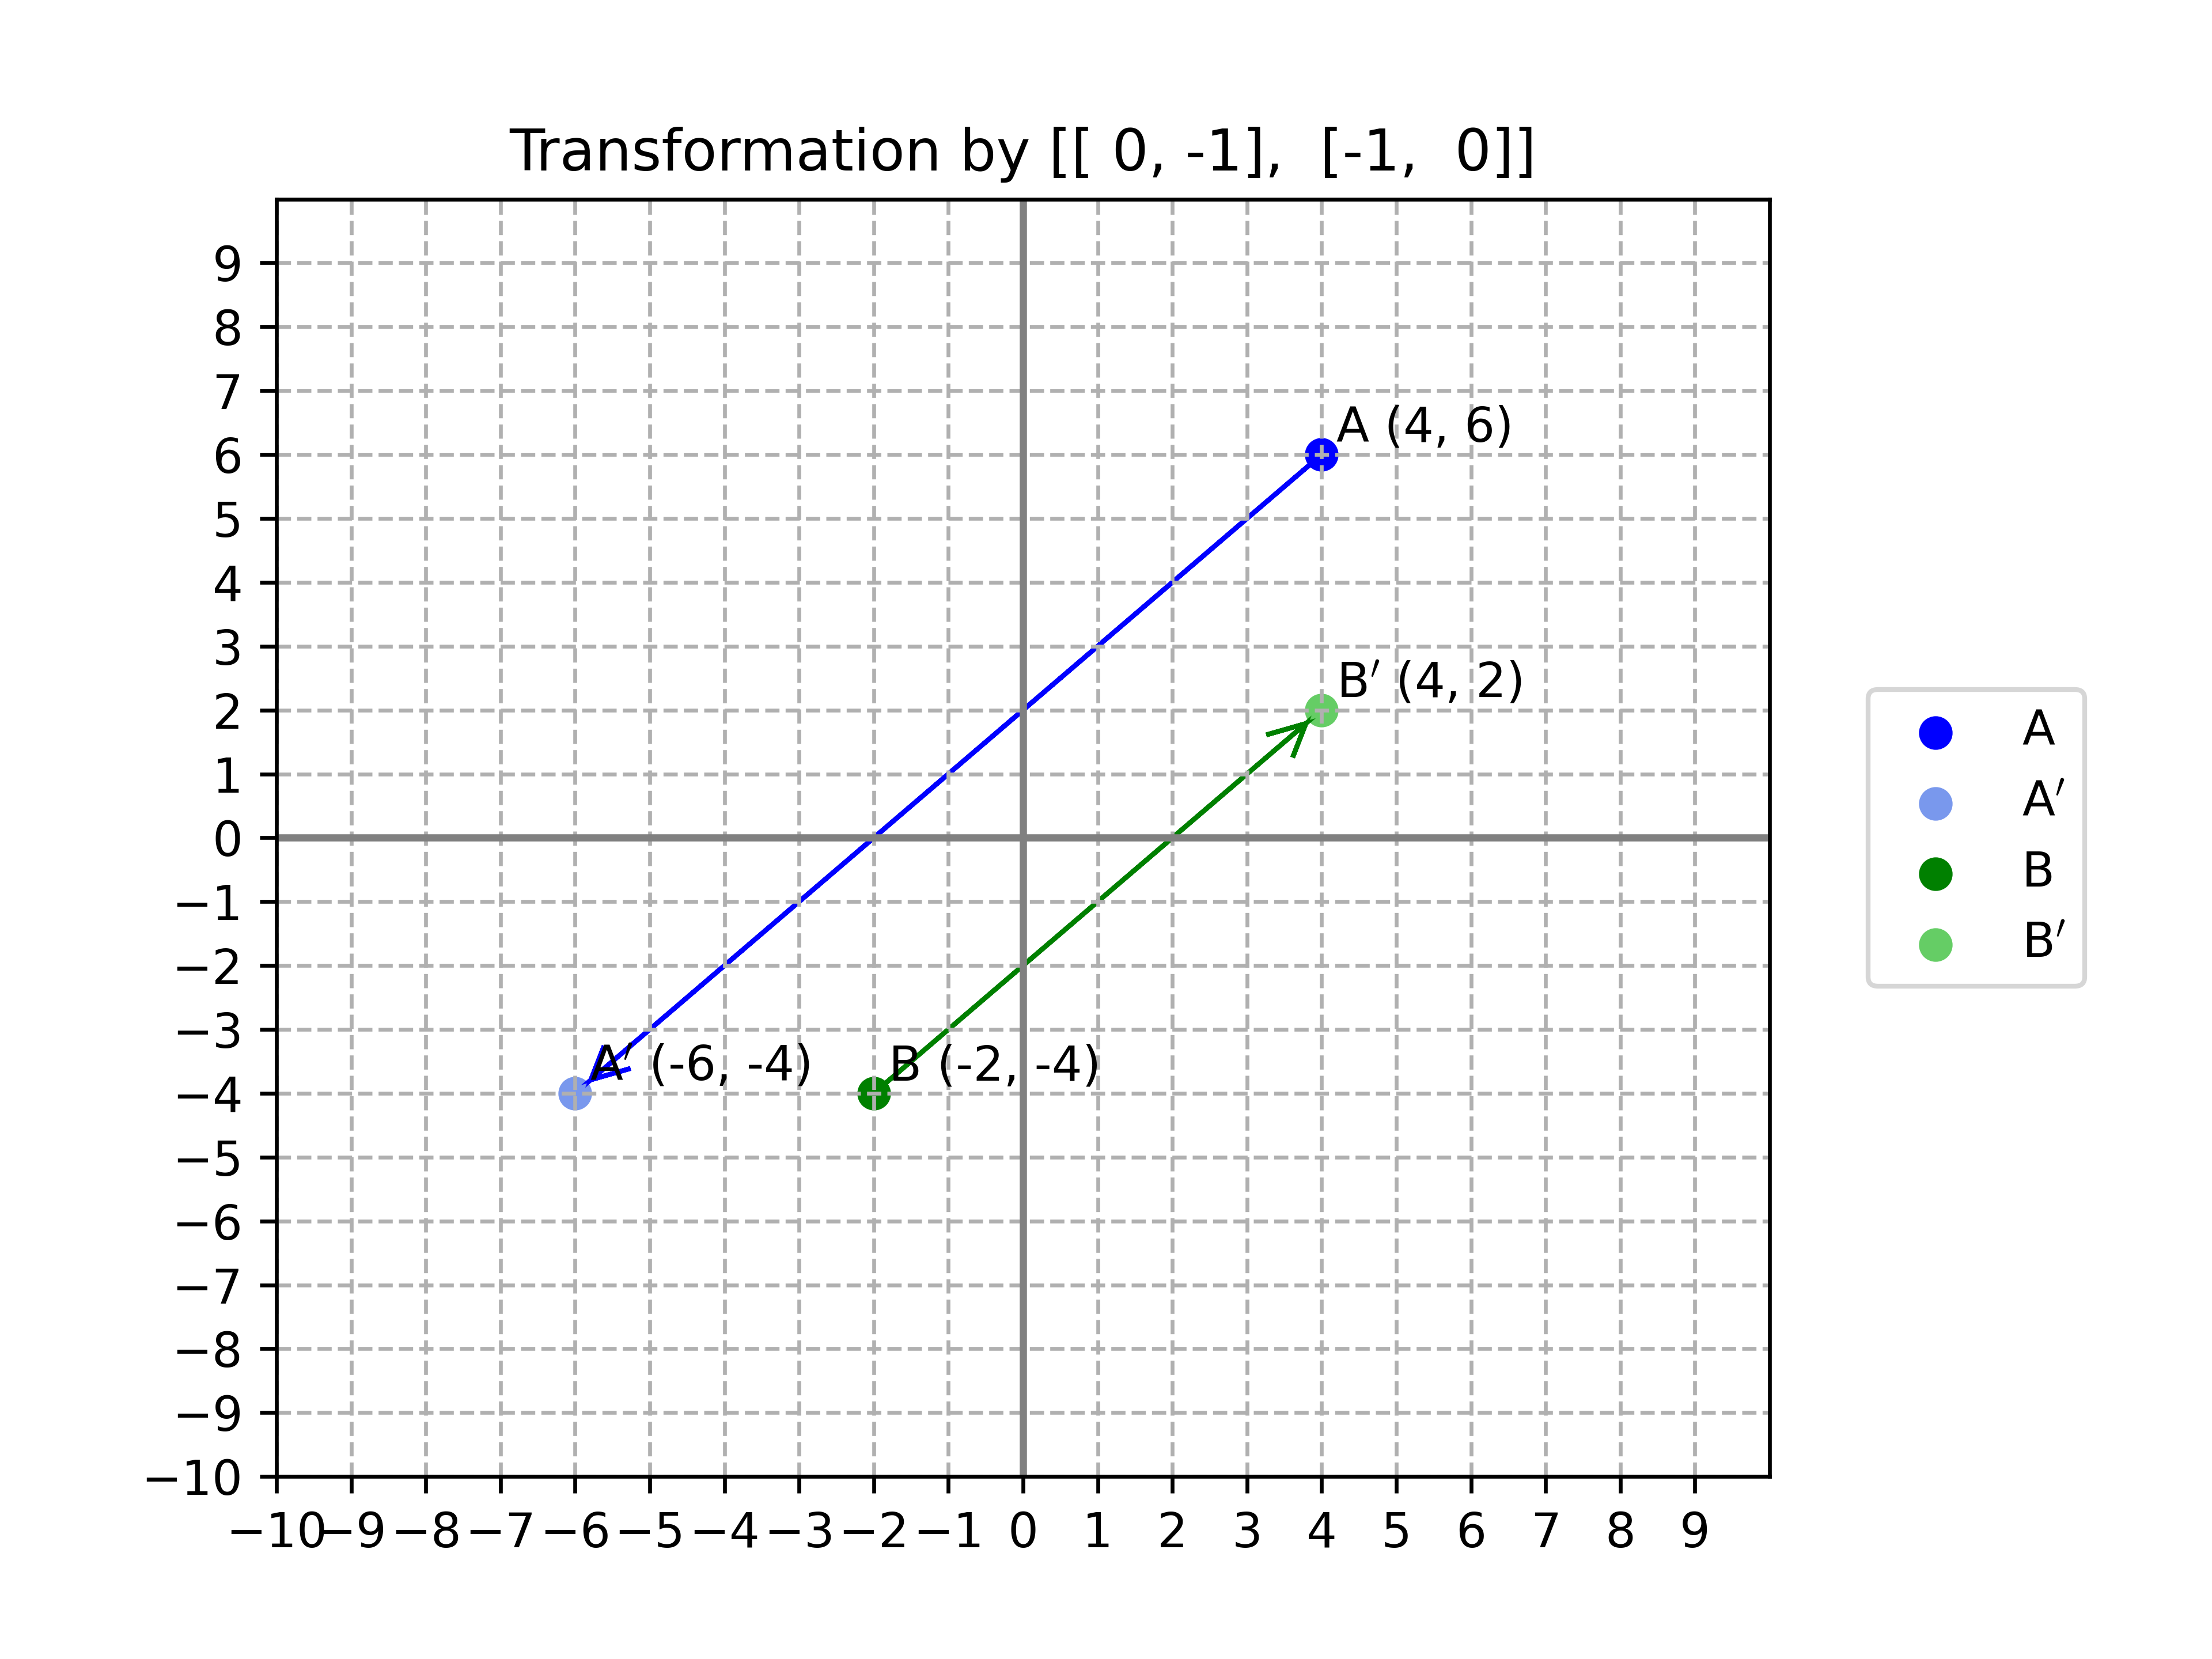
105matrix_reflection_yisnegx = np.array([[0, -1], [-1, 0]])
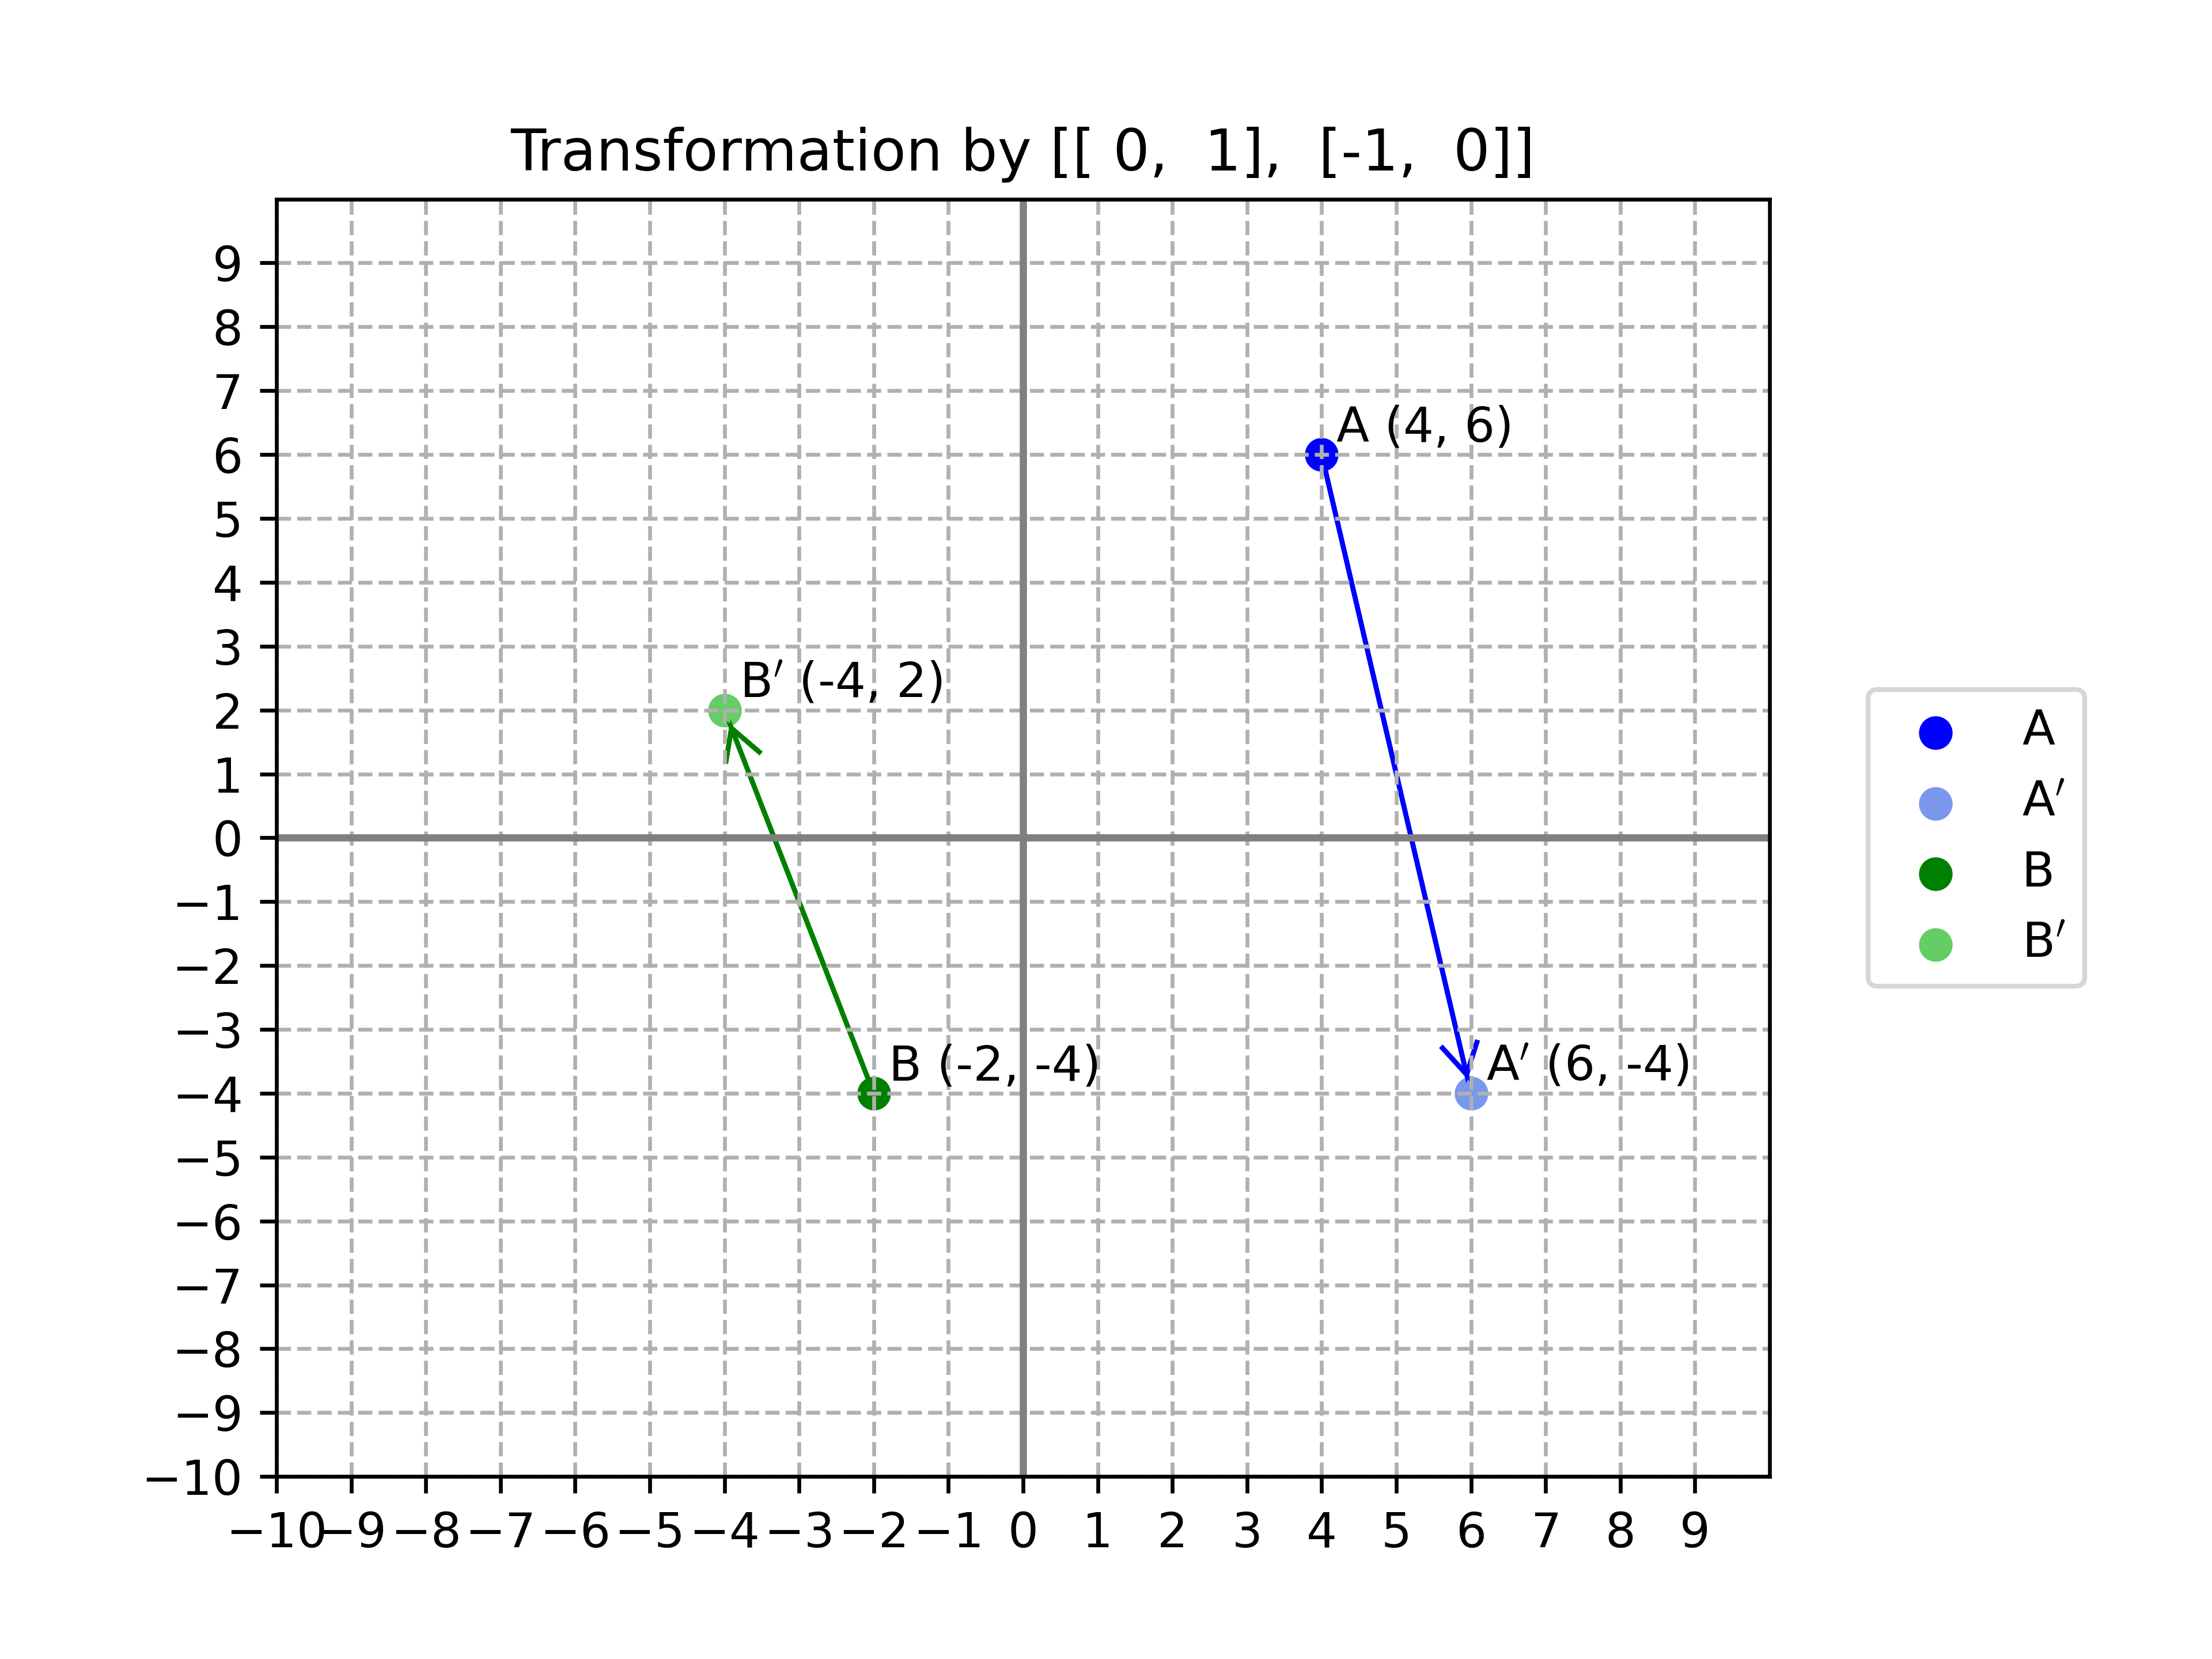
106matrix_rotation_90clock = np.array([[0, 1], [-1, 0]])
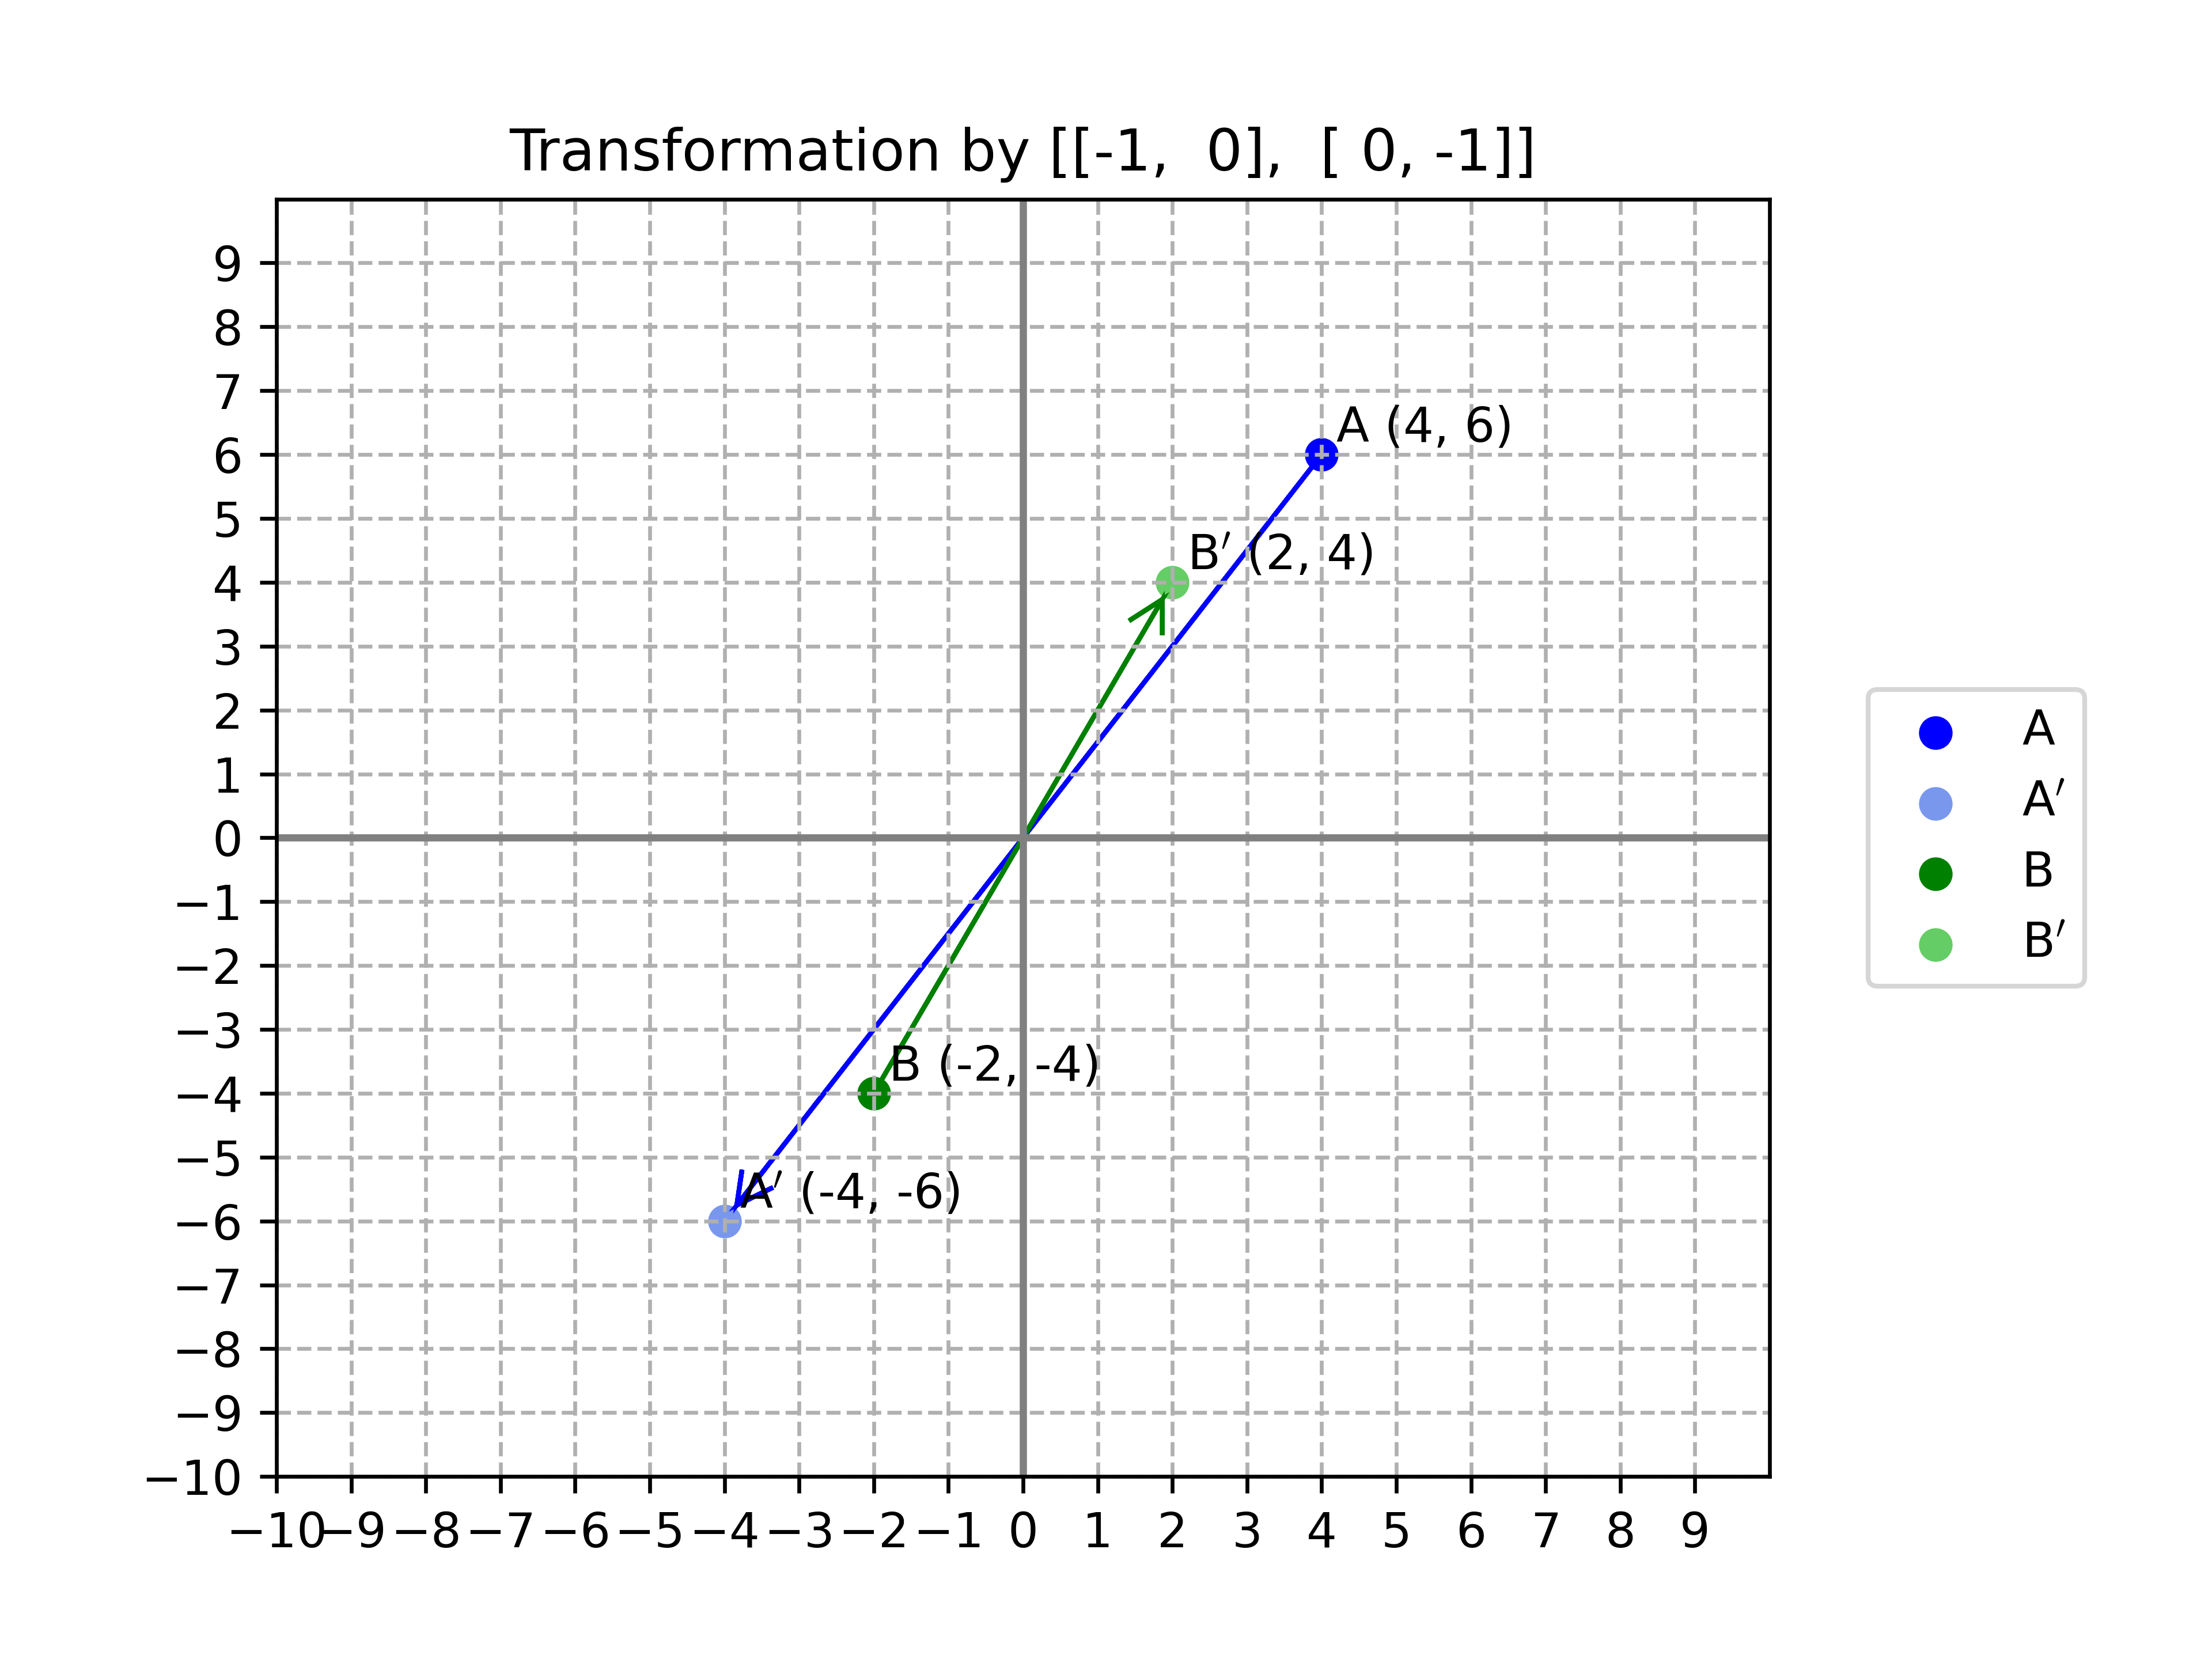
107matrix_rotation_180clock = np.array([[-1, 0], [0, -1]])
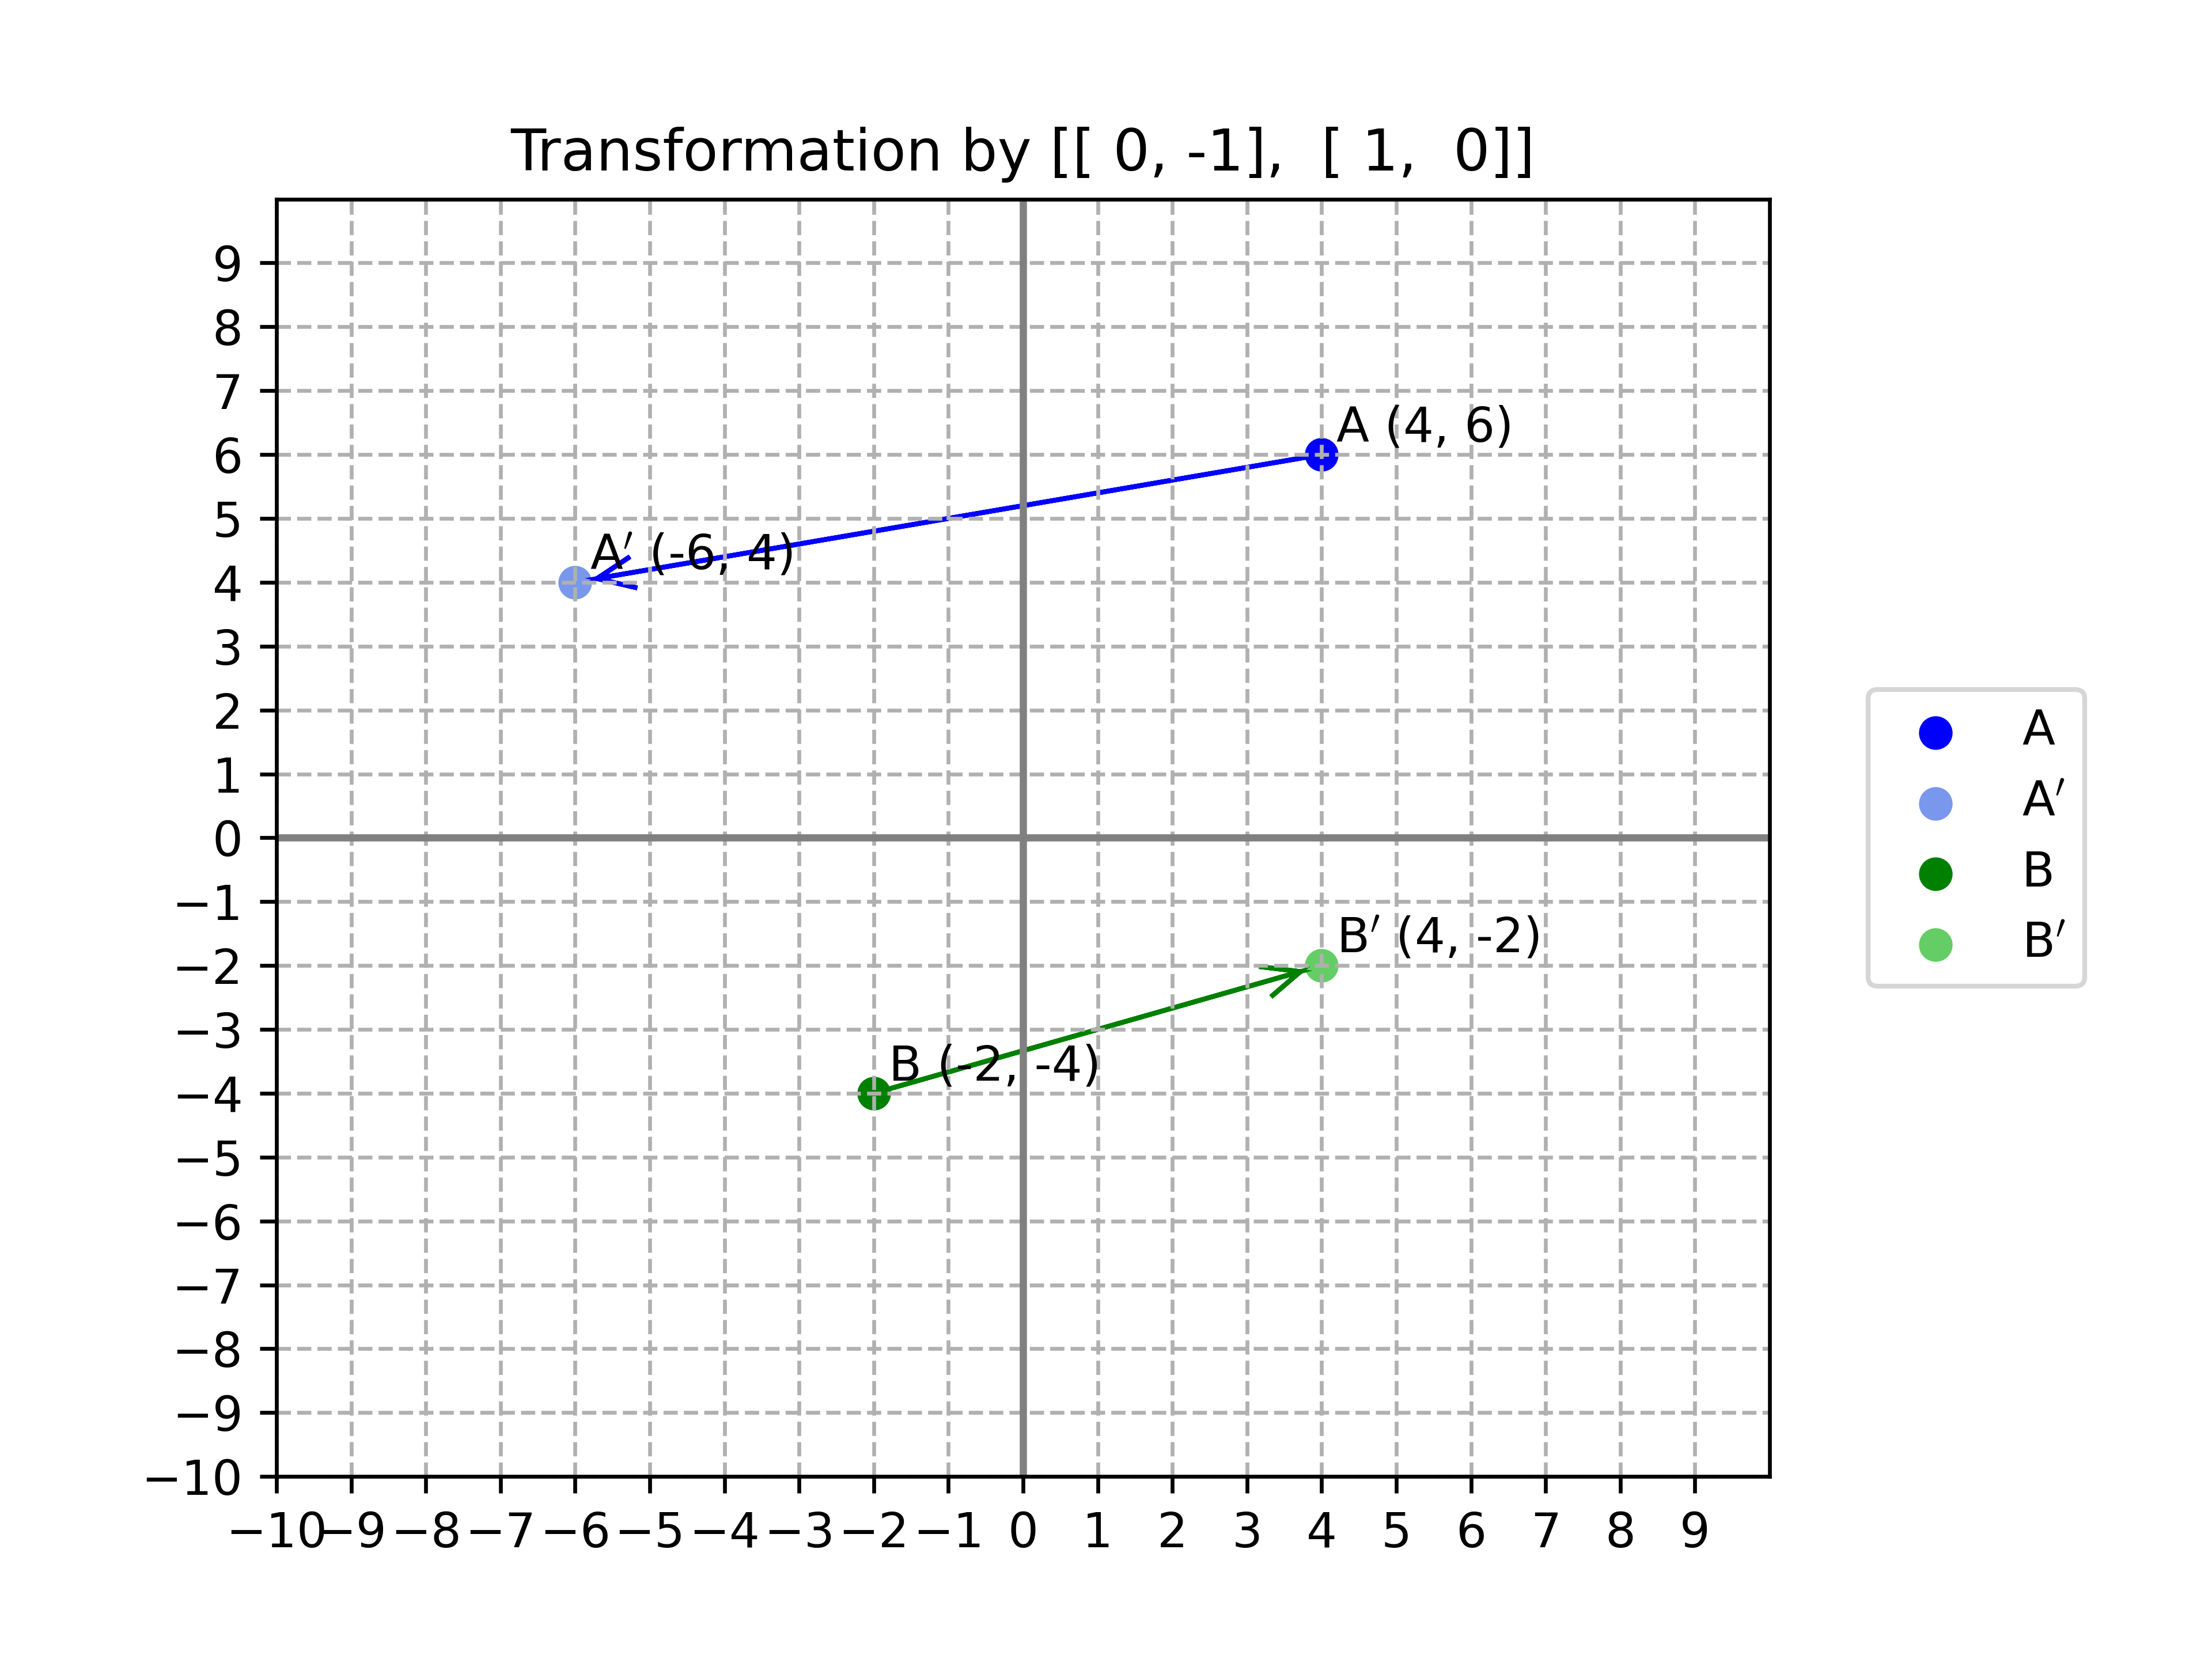
108matrix_rotation_270clock = np.array([[0, -1], [1, 0]])
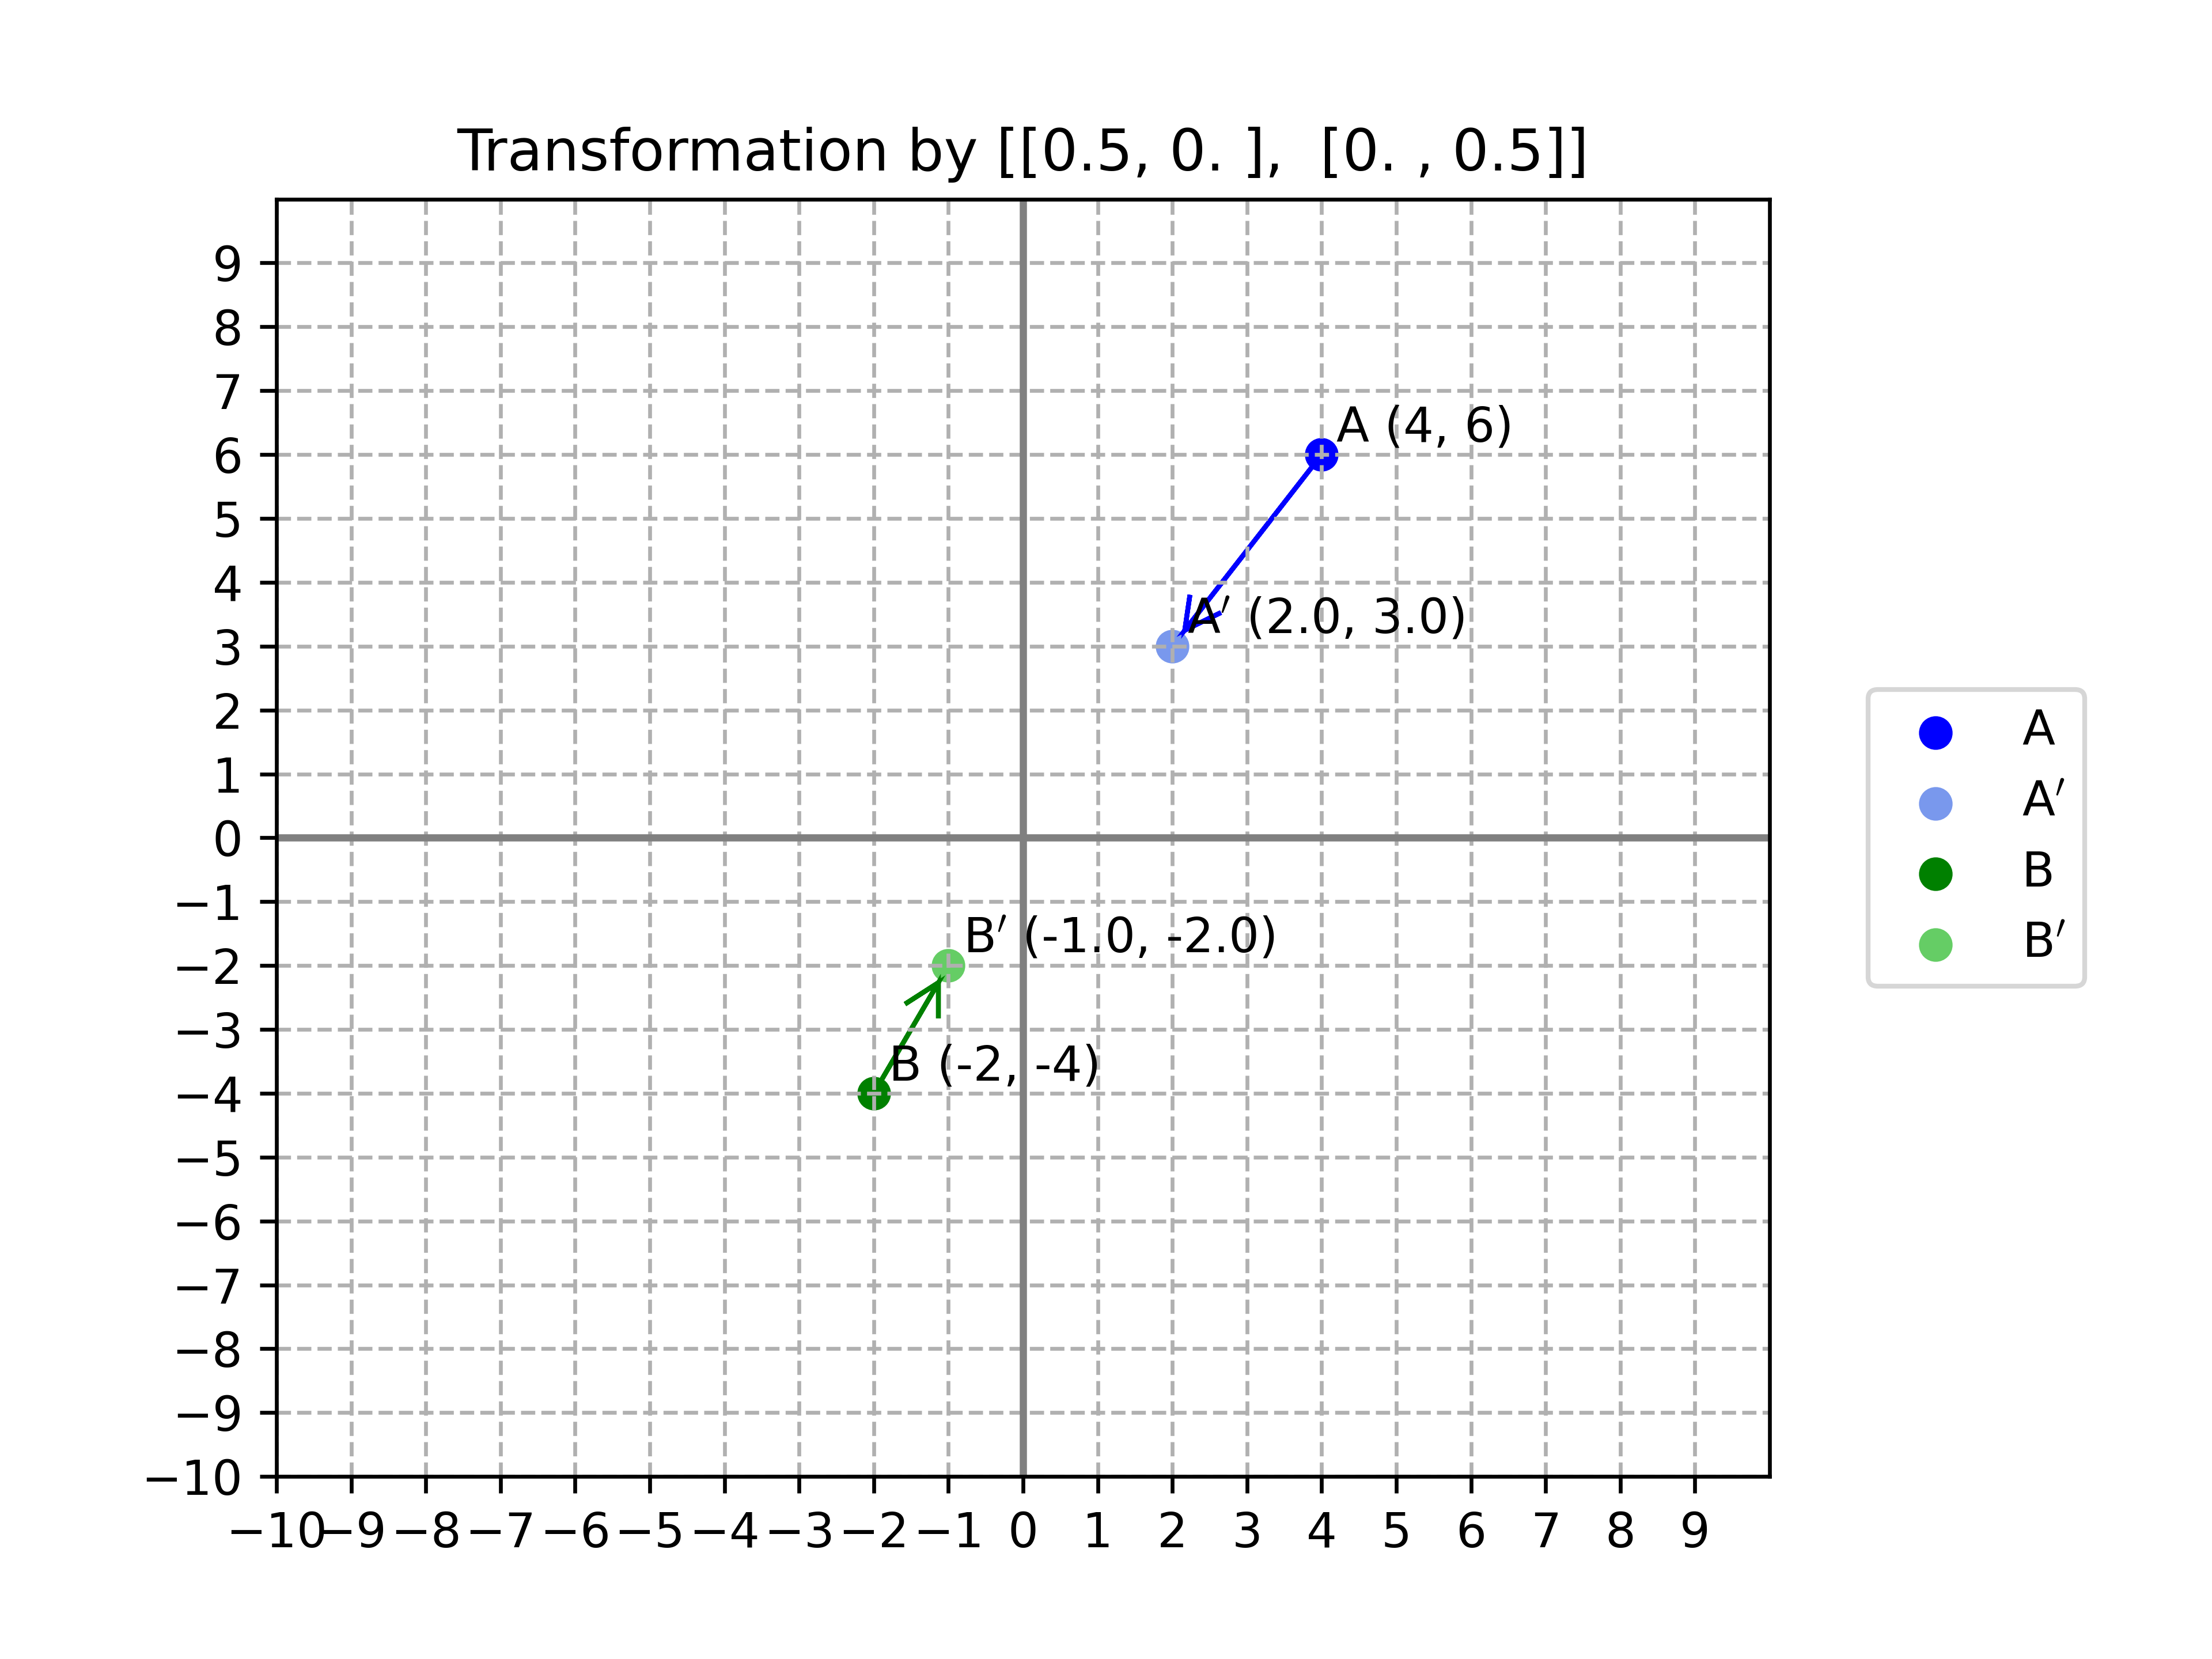
109matrix_dilation_05 = np.array([[0.5, 0], [0, 0.5]])
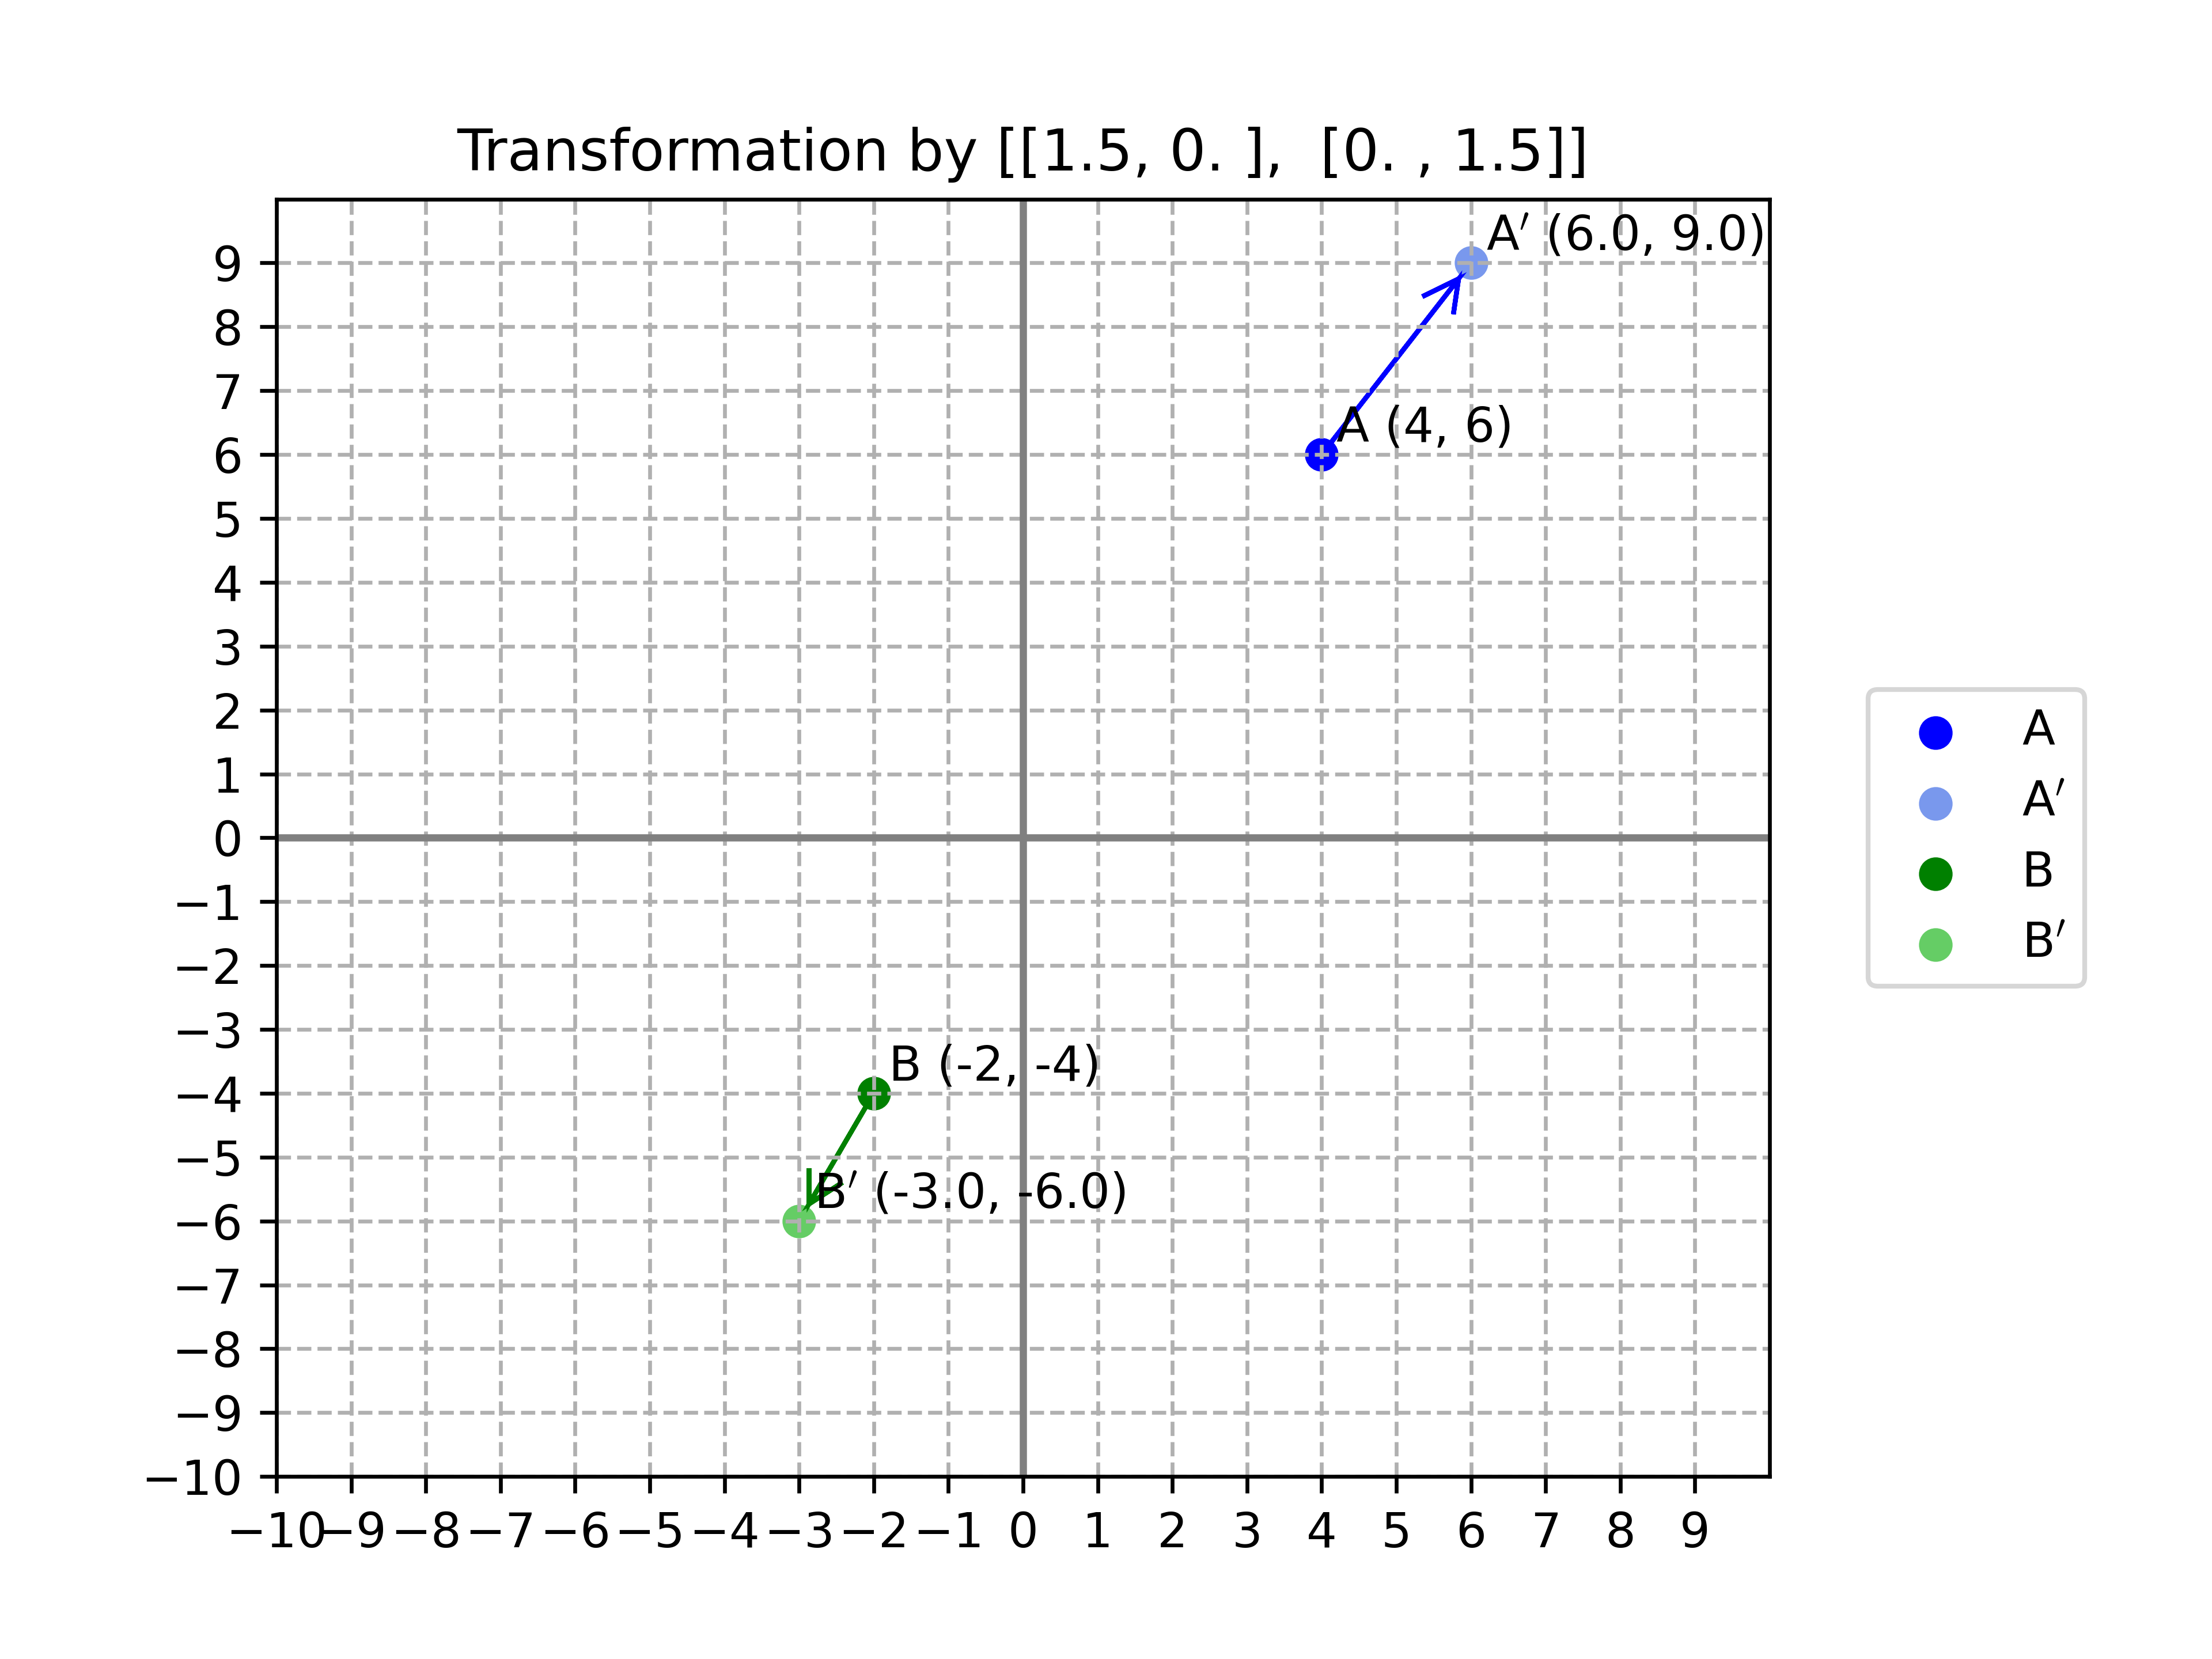
110matrix_dilation_15 = np.array([[1.5, 0], [0, 1.5]])
111plot_transformation(points, point_names, matrix_reflection_x,"matrix_reflection_x.png")
112plot_transformation(points, point_names, matrix_reflection_y,"matrix_reflection_y.png")
113plot_transformation(points, point_names, matrix_reflection_yisx,"matrix_reflection_y=x.png")
114plot_transformation(points, point_names, matrix_reflection_yisnegx,"matrix_reflection_y=-x.png")
115plot_transformation(points, point_names, matrix_rotation_90clock,"matrix_rotation_90clock.png")
116plot_transformation(points, point_names, matrix_rotation_180clock,"matrix_rotation_180clock.png")
117plot_transformation(points, point_names, matrix_rotation_270clock,"matrix_rotation_270clock.png")
118plot_transformation(points, point_names, matrix_dilation_05,"matrix_dilation_05.png")
119plot_transformation(points, point_names, matrix_dilation_15,"matrix_dilation_15.png")
3.4. Reflections
Examples of the reflection of multiple points is shown below.
3.5. Rotations
Examples of the rotation of multiple points is shown below.
3.6. Dilation
An example of dilation of multiple points is shown below.