1. Random walks
VC2M5N10: level 5: Follow a mathematical algorithm involving branching and repetition (iteration); create and use algorithms involving a sequence of steps and decisions and digital tools to experiment with factors, multiples and divisibility; identify, interpret and describe emerging patterns
simulating a simple random walk
1.1. 1D walk plot: Walking the plank
Simulate walking the plank on a pirate ship.
Have 9 positions on the plank, from 1 to 9, with position 1 at the start of the plank and 9 at the end.
Start at position 3.
The pseudocode to simulate a 1D random walk and plot the results.
FUNCTION random_walk_1d(start_position)
    x ← start_position
    positions ← [x]

    WHILE x > 0 AND x < 10 DO
        step ← RANDOM CHOICE FROM [-1, +1]
        IF step = +1 THEN
            x ← x + 1
        ELSE
            x ← x - 1
        ENDIF
        APPEND x TO positions
    ENDWHILE

    RETURN positions
ENDFUNCTION


FUNCTION plot_random_walk_1d(positions)
    DRAW LINE GRAPH OF positions
    SET TITLE ← "Random Walk 1D"
    LABEL X-AXIS ← "Step"
    LABEL Y-AXIS ← "Position"
    CALL save_plot(graph, "random_walk_1D.png")
    DISPLAY graph
ENDFUNCTION


FUNCTION save_plot(graph, filename)
    filepath ← DIRECTORY OF THIS FILE + filename
    SAVE graph TO filepath WITH HIGH RESOLUTION
ENDFUNCTION


BEGIN
    INPUTS:
        start_position ← 3   -- initial position for the walk

    PROCESS:
        positions ← CALL random_walk_1d(start_position)
        CALL plot_random_walk_1d(positions)

    OUTPUT:
        DISPLAY graph of the random walk with labelled axes and title
END
The python to simulate a 1D random walk and plot the results.
 1from pathlib import Path
 2import random
 3import matplotlib.pyplot as plt
 4
 5currfile_dir = Path(__file__).parent
 6
 7
 8def random_walk_1d(start=3):
 9    """
10    Simulates a 1D random walk starting at position `start`.
11    The walk continues until the position is either 0 or 10.
12    Returns a list of all positions visited during the walk.
13    """
14    x = start
15    x_positions = [x]
16    while x > 0 and x < 10:
17        step = random.choice([-1, 1])
18        if step == 1:
19            x += 1
20        else:
21            x -= 1
22        x_positions.append(x)
23    return x_positions
24
25
26def plot_random_walk_1d(positions):
27    """
28    Plots the positions of a 1D random walk.
29    `positions` is a list of positions visited during the walk.
30    """
31    # print(positions)
32    plt.plot(positions)
33    plt.title("Random Walk 1D")
34    plt.xlabel("Step")
35    plt.ylabel("Position")
36    save_plot(plt, "random_walk_1D.png")
37    plt.show()
38
39
40def save_plot(plot, filename):
41    """
42    Saves the given plot to a file with the given filename within the curr directory
43    """
44    filepath = currfile_dir / filename
45    plot.savefig(filepath, dpi=600)
46
47
48positions = random_walk_1d(start=3)
49plot_random_walk_1d(positions)
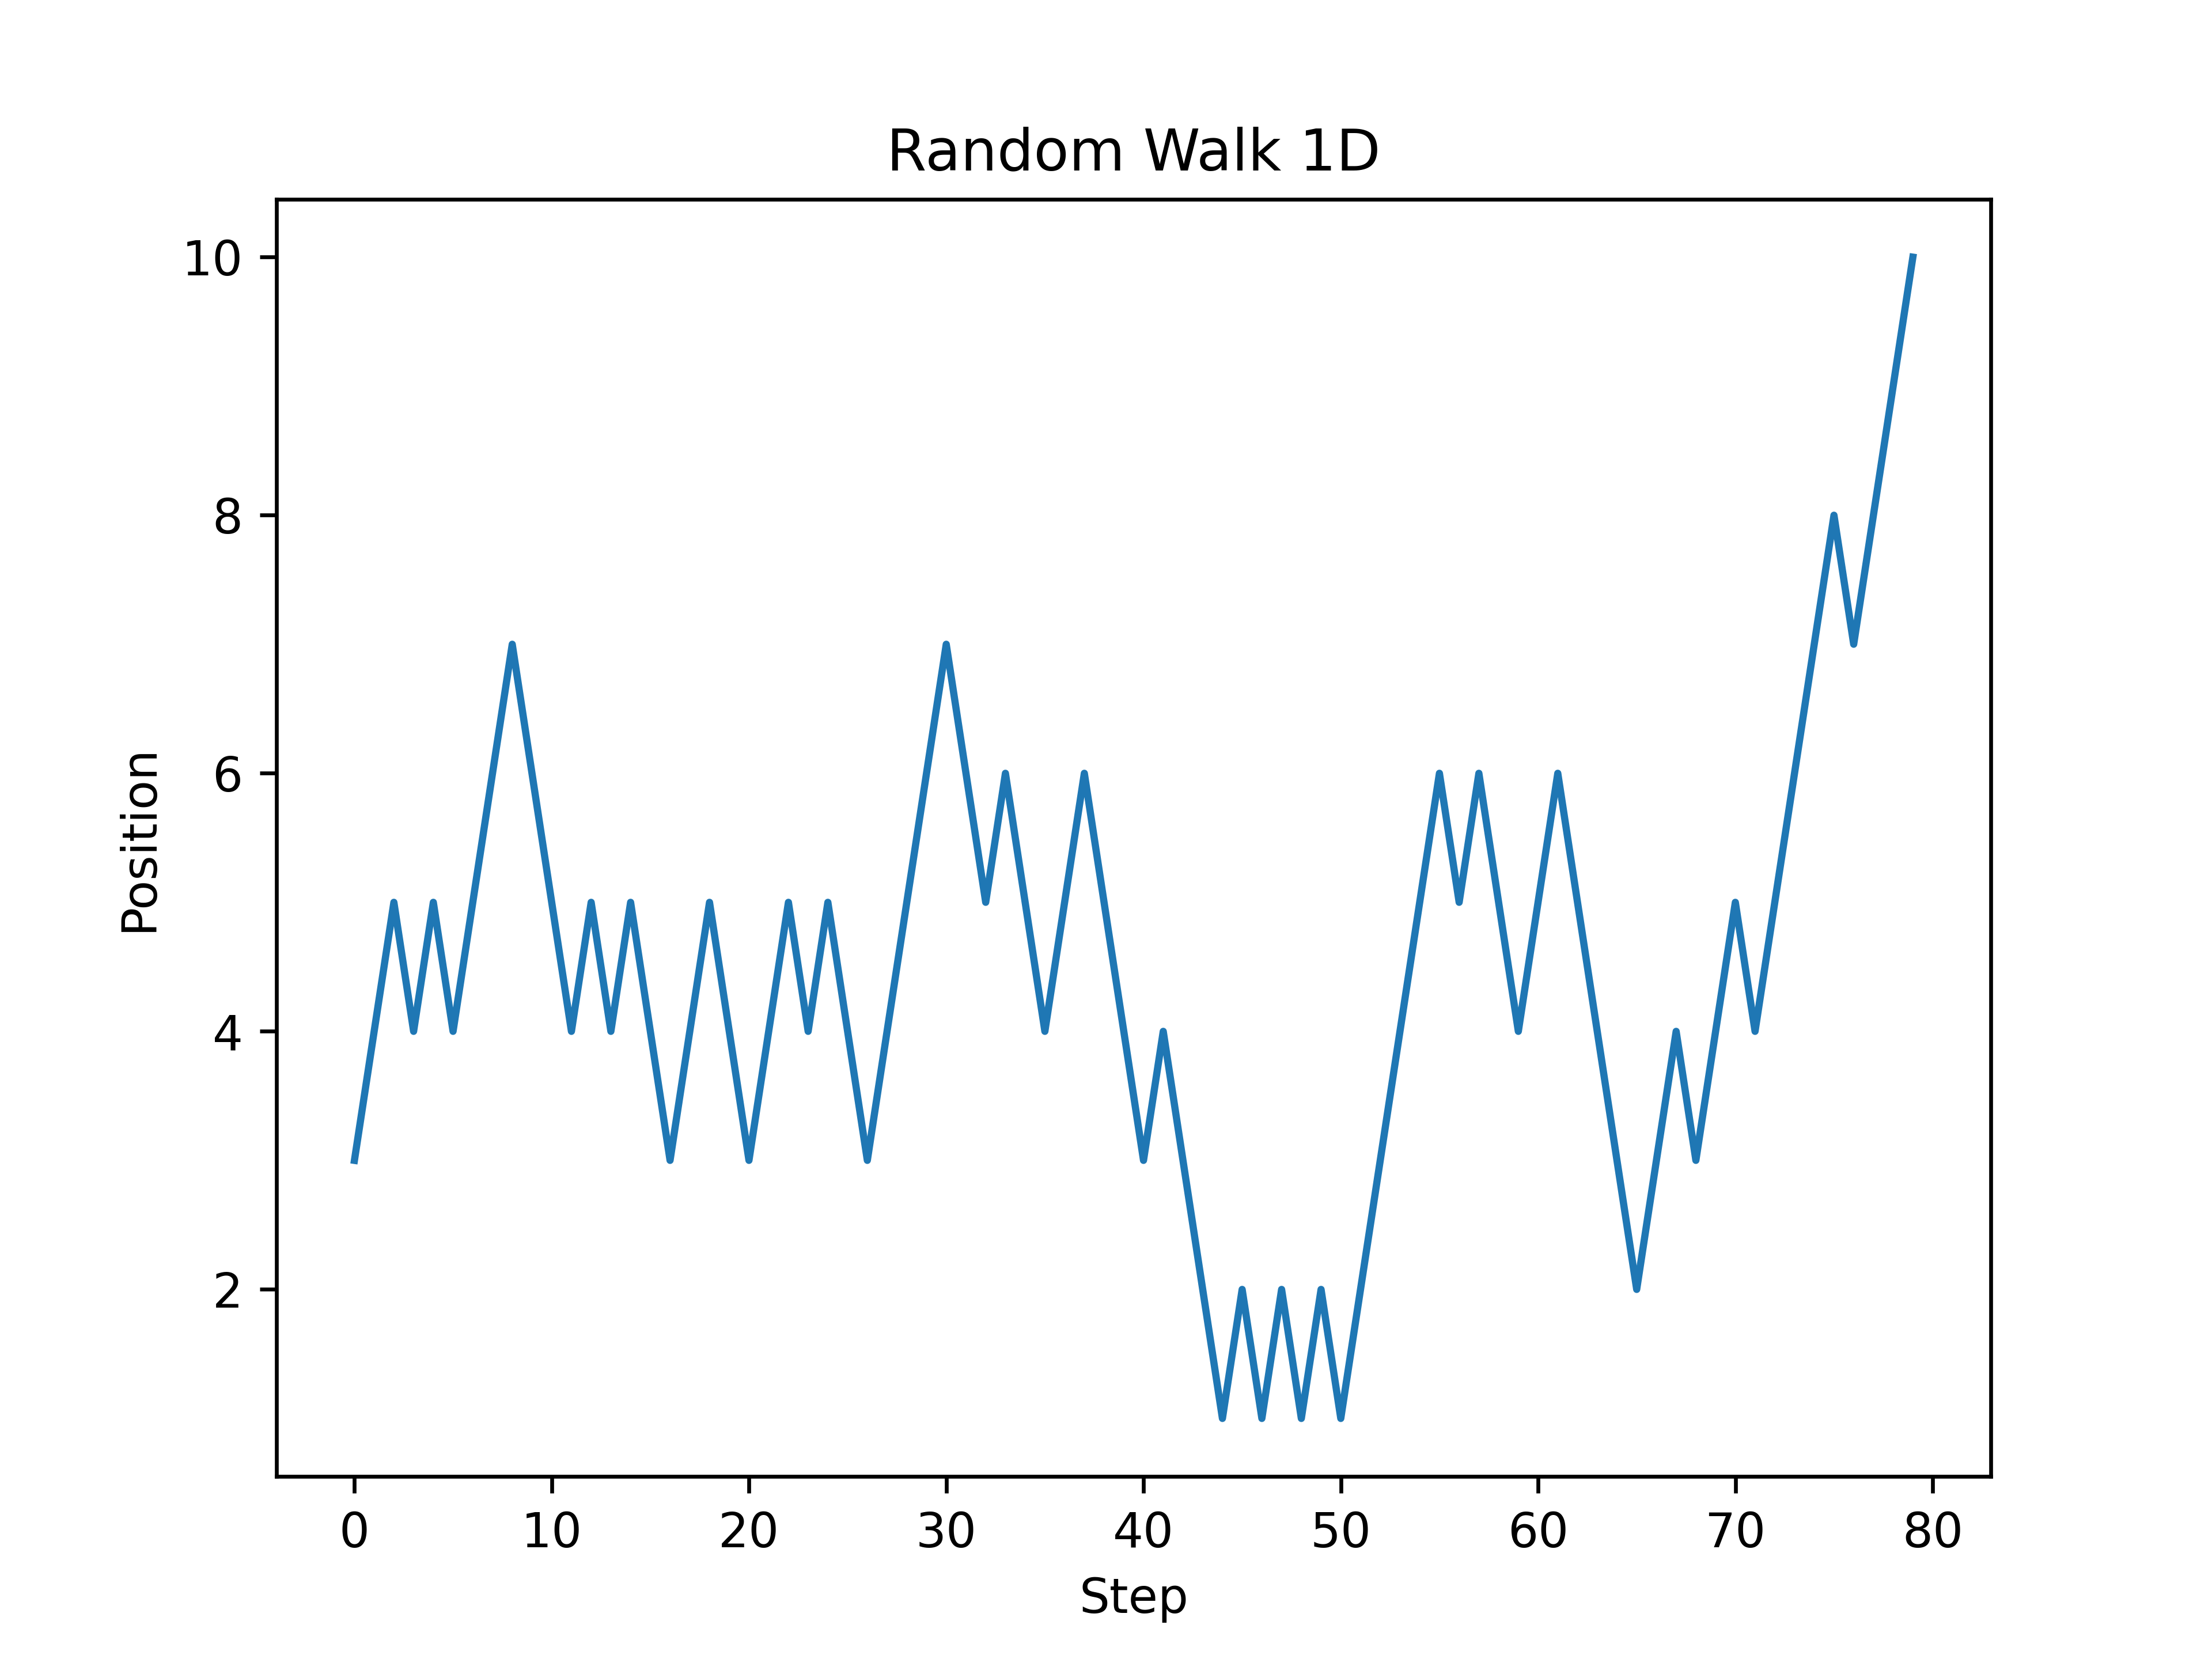
Examples 1D walks are below:
1.2. Walking the plank analysis
Simulate walking the plank on a pirate ship.
Have 9 positions on the plank, from 1 to 9, with position 1 at the start of the plank and 9 at the end.
1"""Simulates a 1D random walk
2"""
3from pathlib import Path
4import random
5import matplotlib.pyplot as plt
6
7currfile_dir = Path(__file__).parent
8
9
10def random_walk_1d(start=3):
11 """
12 Simulates a 1D random walk starting at position `start`.
13 The walk continues until the position is either 0 or 10.
14 Returns a list of all positions visited during the walk.
15 """
16 x = start
17 x_positions = [x]
18 while x > 0 and x < 10:
19 step = random.choice([-1, 1])
20 if step == 1:
21 x += 1
22 else:
23 x -= 1
24 x_positions.append(x)
25 return x_positions
26
27
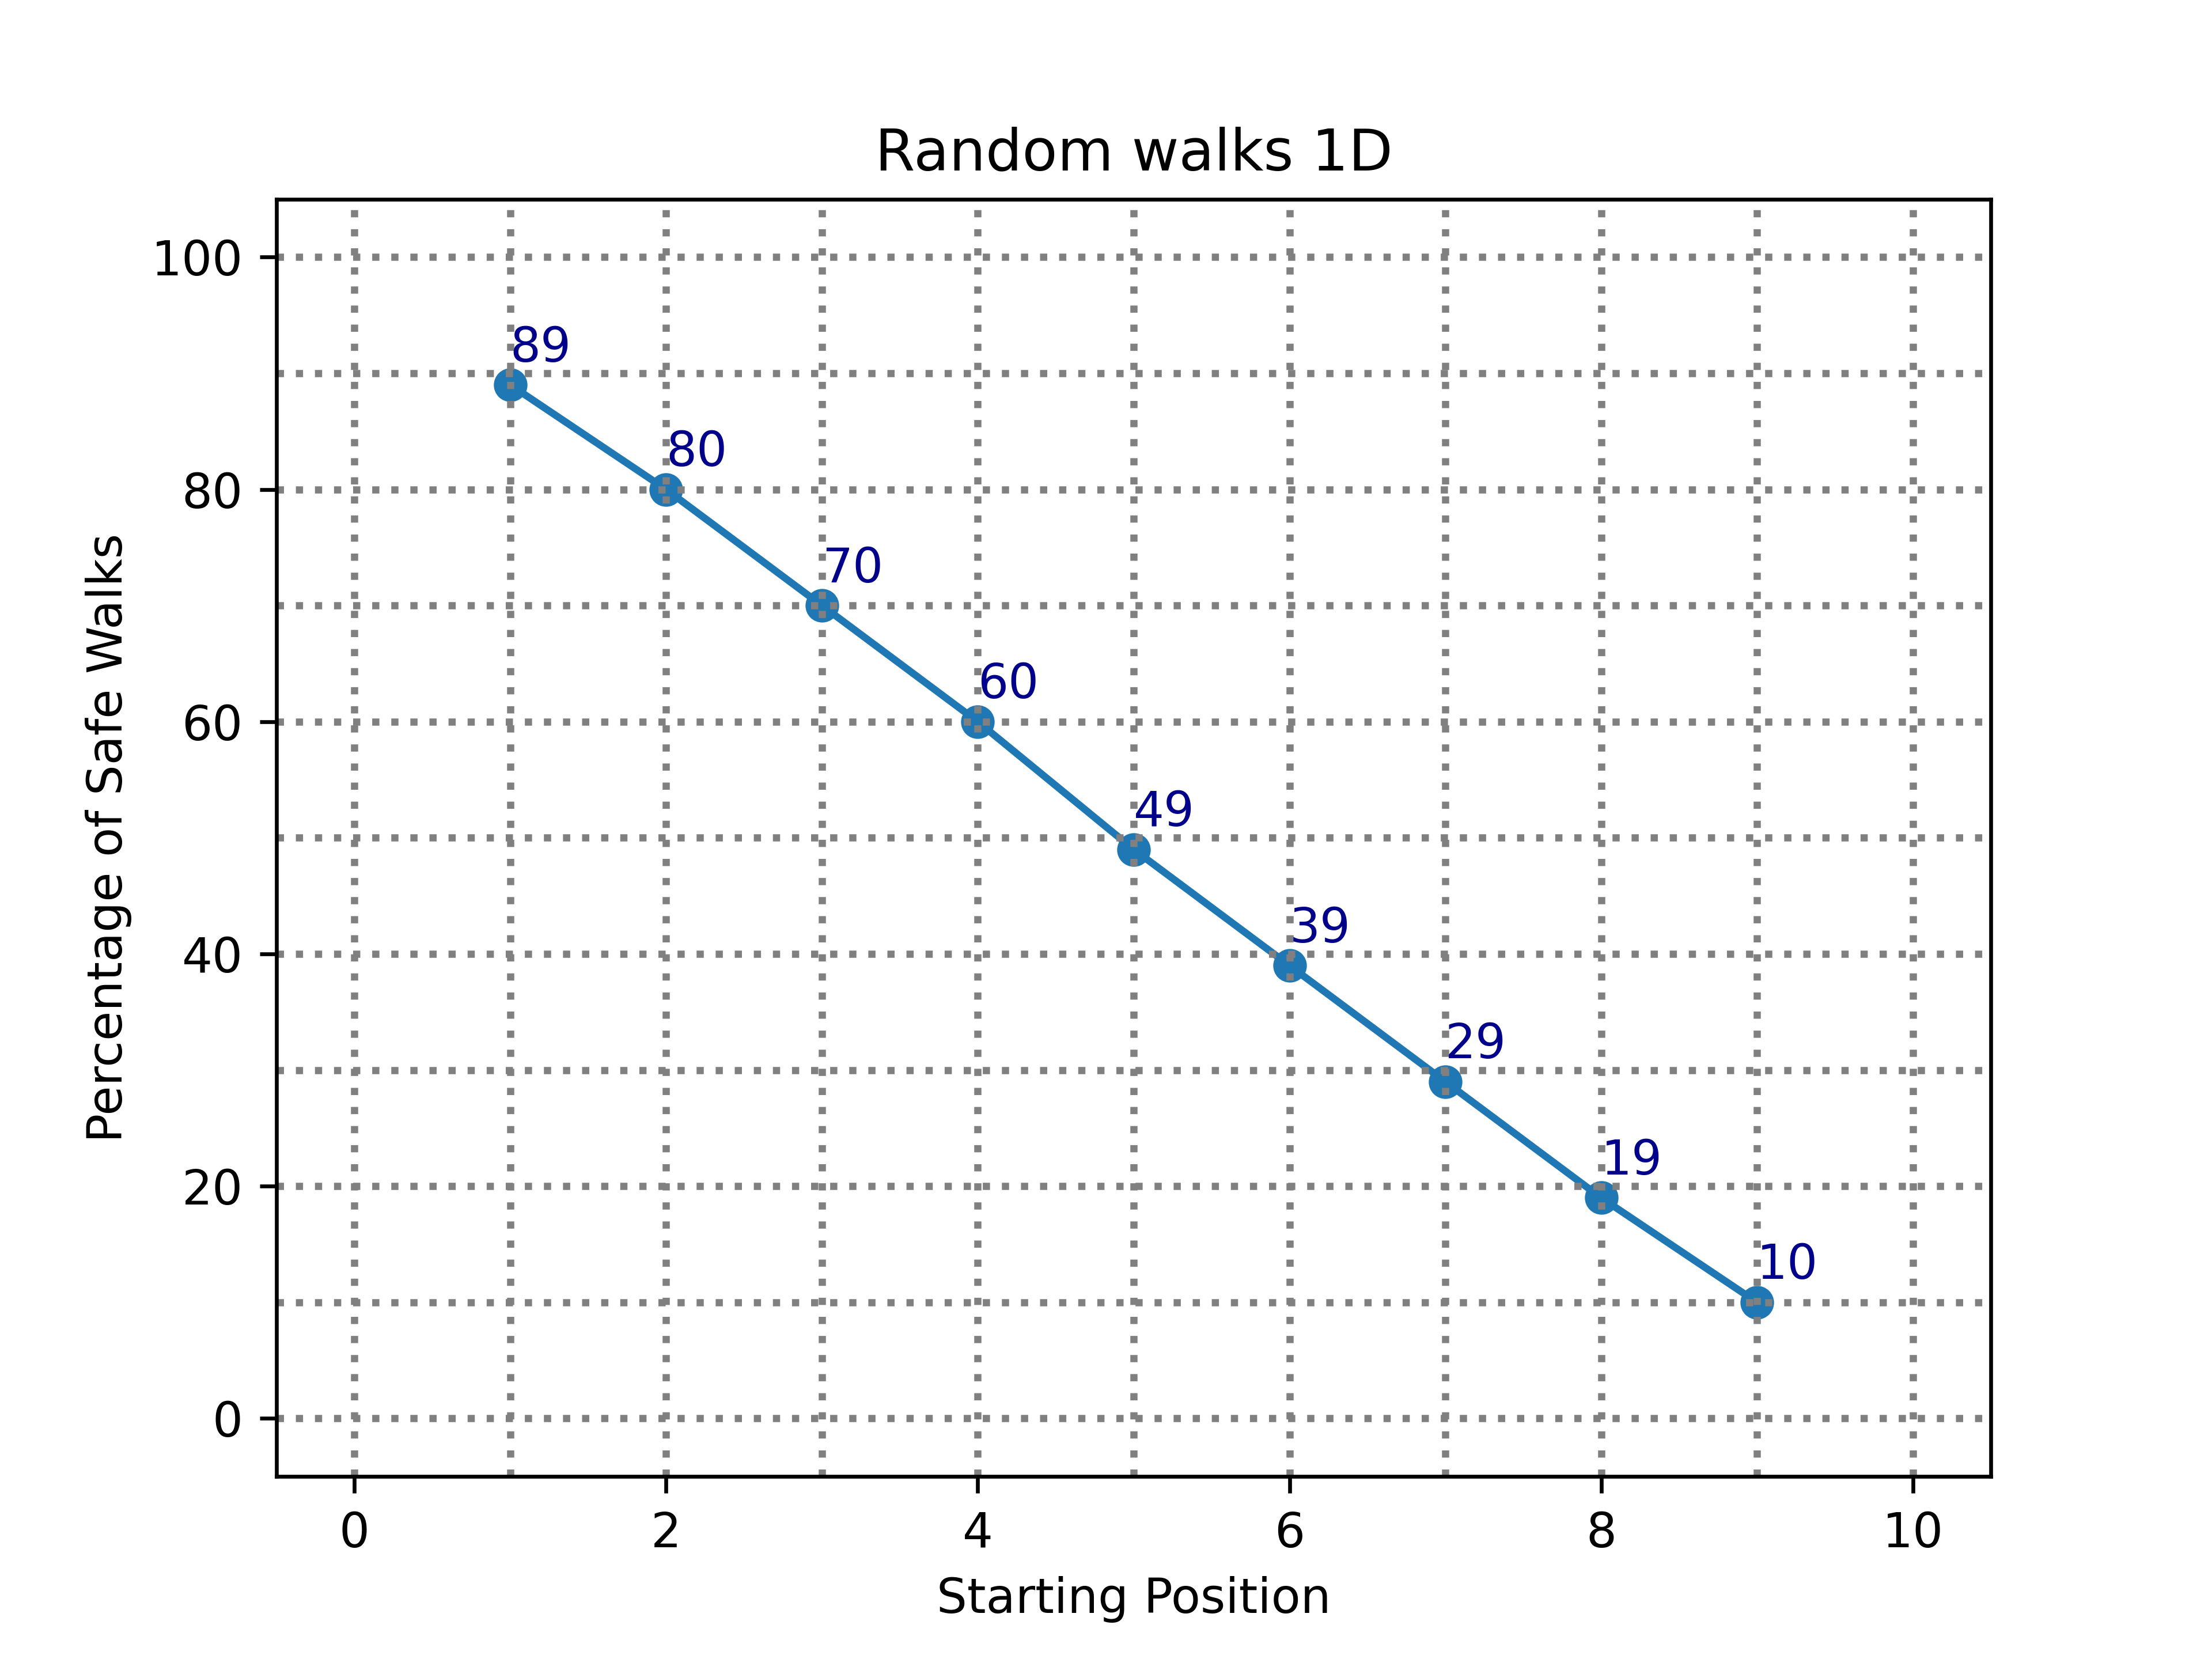
28def calculate_random_walk_1d(start_poss, number_of_walks):
29 """
30 Calculates the percentage of safe walks for each starting position in `start_poss`.
31 A walk is considered safe if it ends at position 0.
32 Returns a list of percentages for each starting position.
33 """
34 safe_counts = []
35 for start_pos in start_poss:
36 safe_count = 0
37 for _ in range(number_of_walks):
38 walk_x_positions = random_walk_1d(start_pos)
39 if walk_x_positions[-1] == 0:
40 safe_count += 1
41 safe_counts.append(int(100 * safe_count / number_of_walks))
42 return safe_counts
43
44
45def plot_random_walk_1d(y, x):
46 """
47 Plots the percentage of safe walks for each starting position.
48 `y` is a list of starting positions and `x` is a list of percentages.
49 """
50 plt.plot(y, x, marker="o")
51 plt.title("Random walks 1D")
52 plt.xlabel("Starting Position")
53 plt.ylabel("Percentage of Safe Walks")
54 for i in range(0, 110, 10):
55 plt.axhline(y=i, color="gray", linestyle=":")
56 for i in range(0, max(start_poss) + 2):
57 plt.axvline(x=i, color="gray", linestyle=":")
58 for i, j in zip(y, x):
59 plt.annotate(str(j), xy=(i, j + 2), color="darkblue")
60 save_plot(plt, "random_walks_1D.png")
61 plt.show()
62
63
64def save_plot(plot, filename):
65 """
66 Saves the given plot to a file with the given filename within the curr directory
67 """
68 filepath = currfile_dir / filename
69 plot.savefig(filepath, dpi=600)
70
71
72number_of_walks = 10000
73start_poss = range(1, 10)
74safe_counts = calculate_random_walk_1d(start_poss, number_of_walks)
75plot_random_walk_1d(start_poss, safe_counts)
The code below simulates a 1D random walk.
The random_walk_1d function takes a starting position as an argument, with a default value of 3.
The function simulates a random walk by generating random steps using the random.randint function.
If the step is 1, the position is incremented by 1, otherwise it is decremented by 1.
The new position is then appended to the x_positions list.
This continues until the position reaches either 0 or 10.
The script then simulates number_of_walks walks for each starting position from 1 to 9.
For each walk, it checks if the final position is 0 and if so, increments the safe_count variable.
Finally, it prints the starting position and the percentage of walks that ended at position 0.
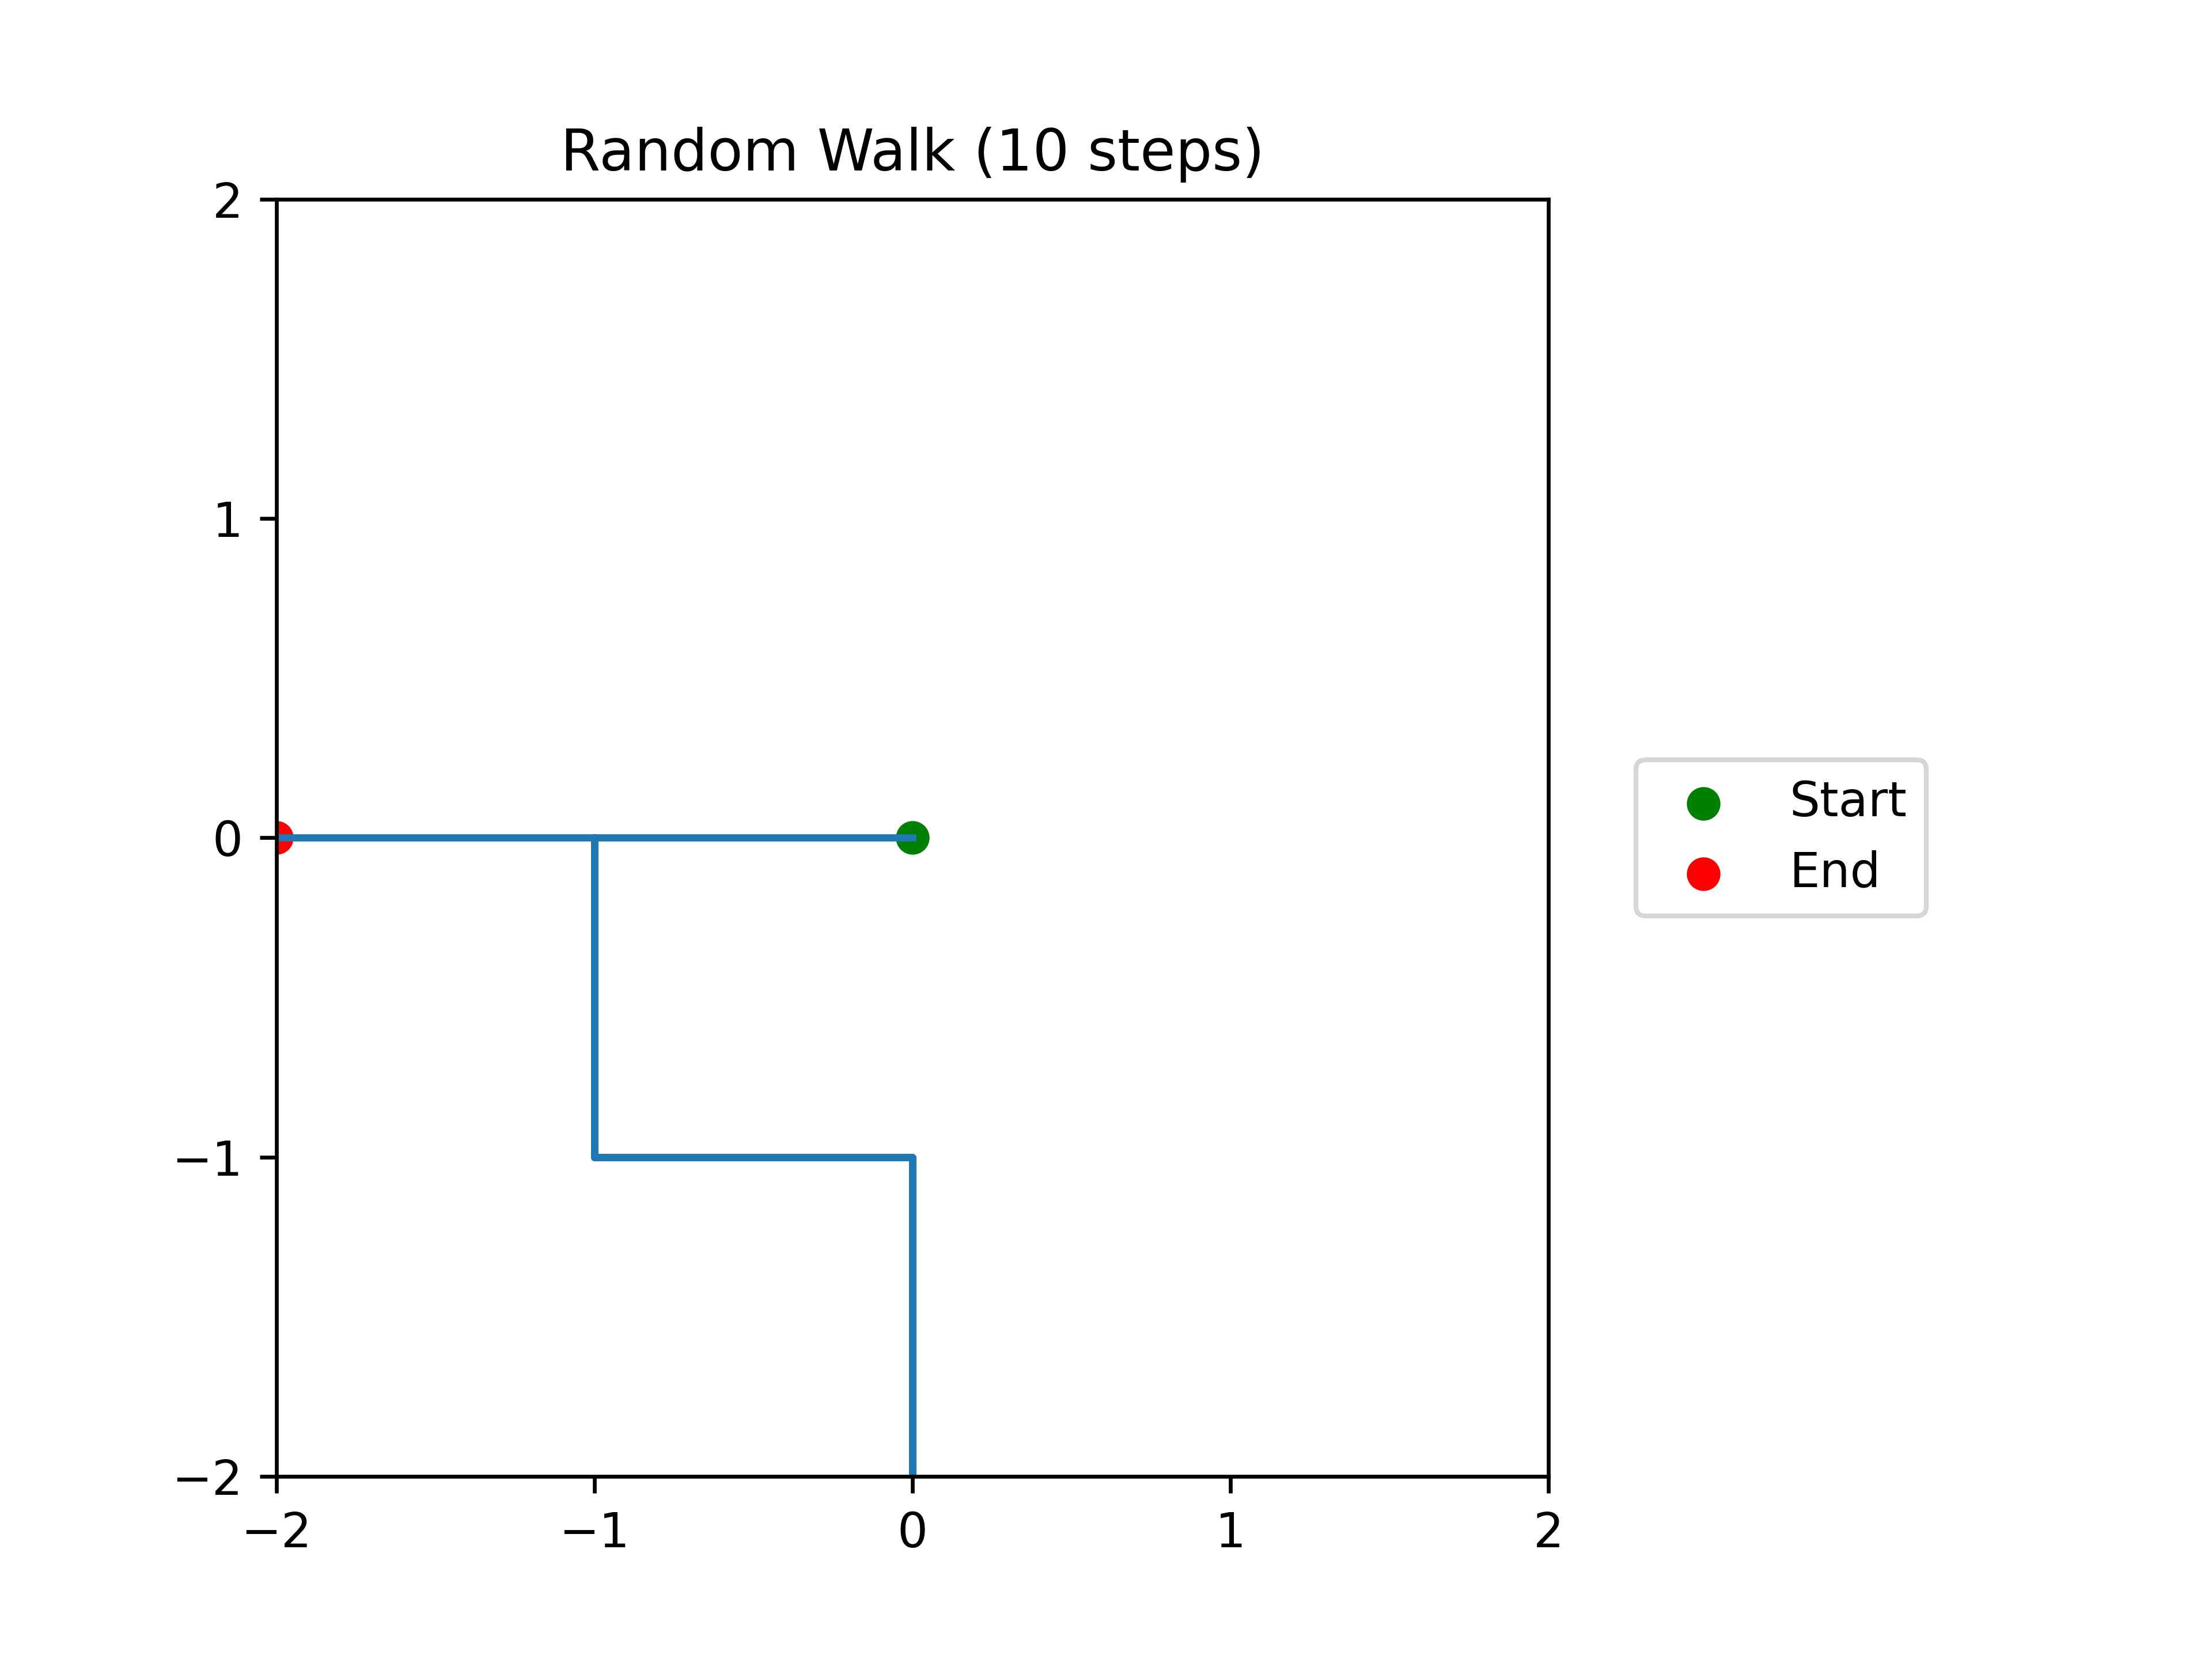
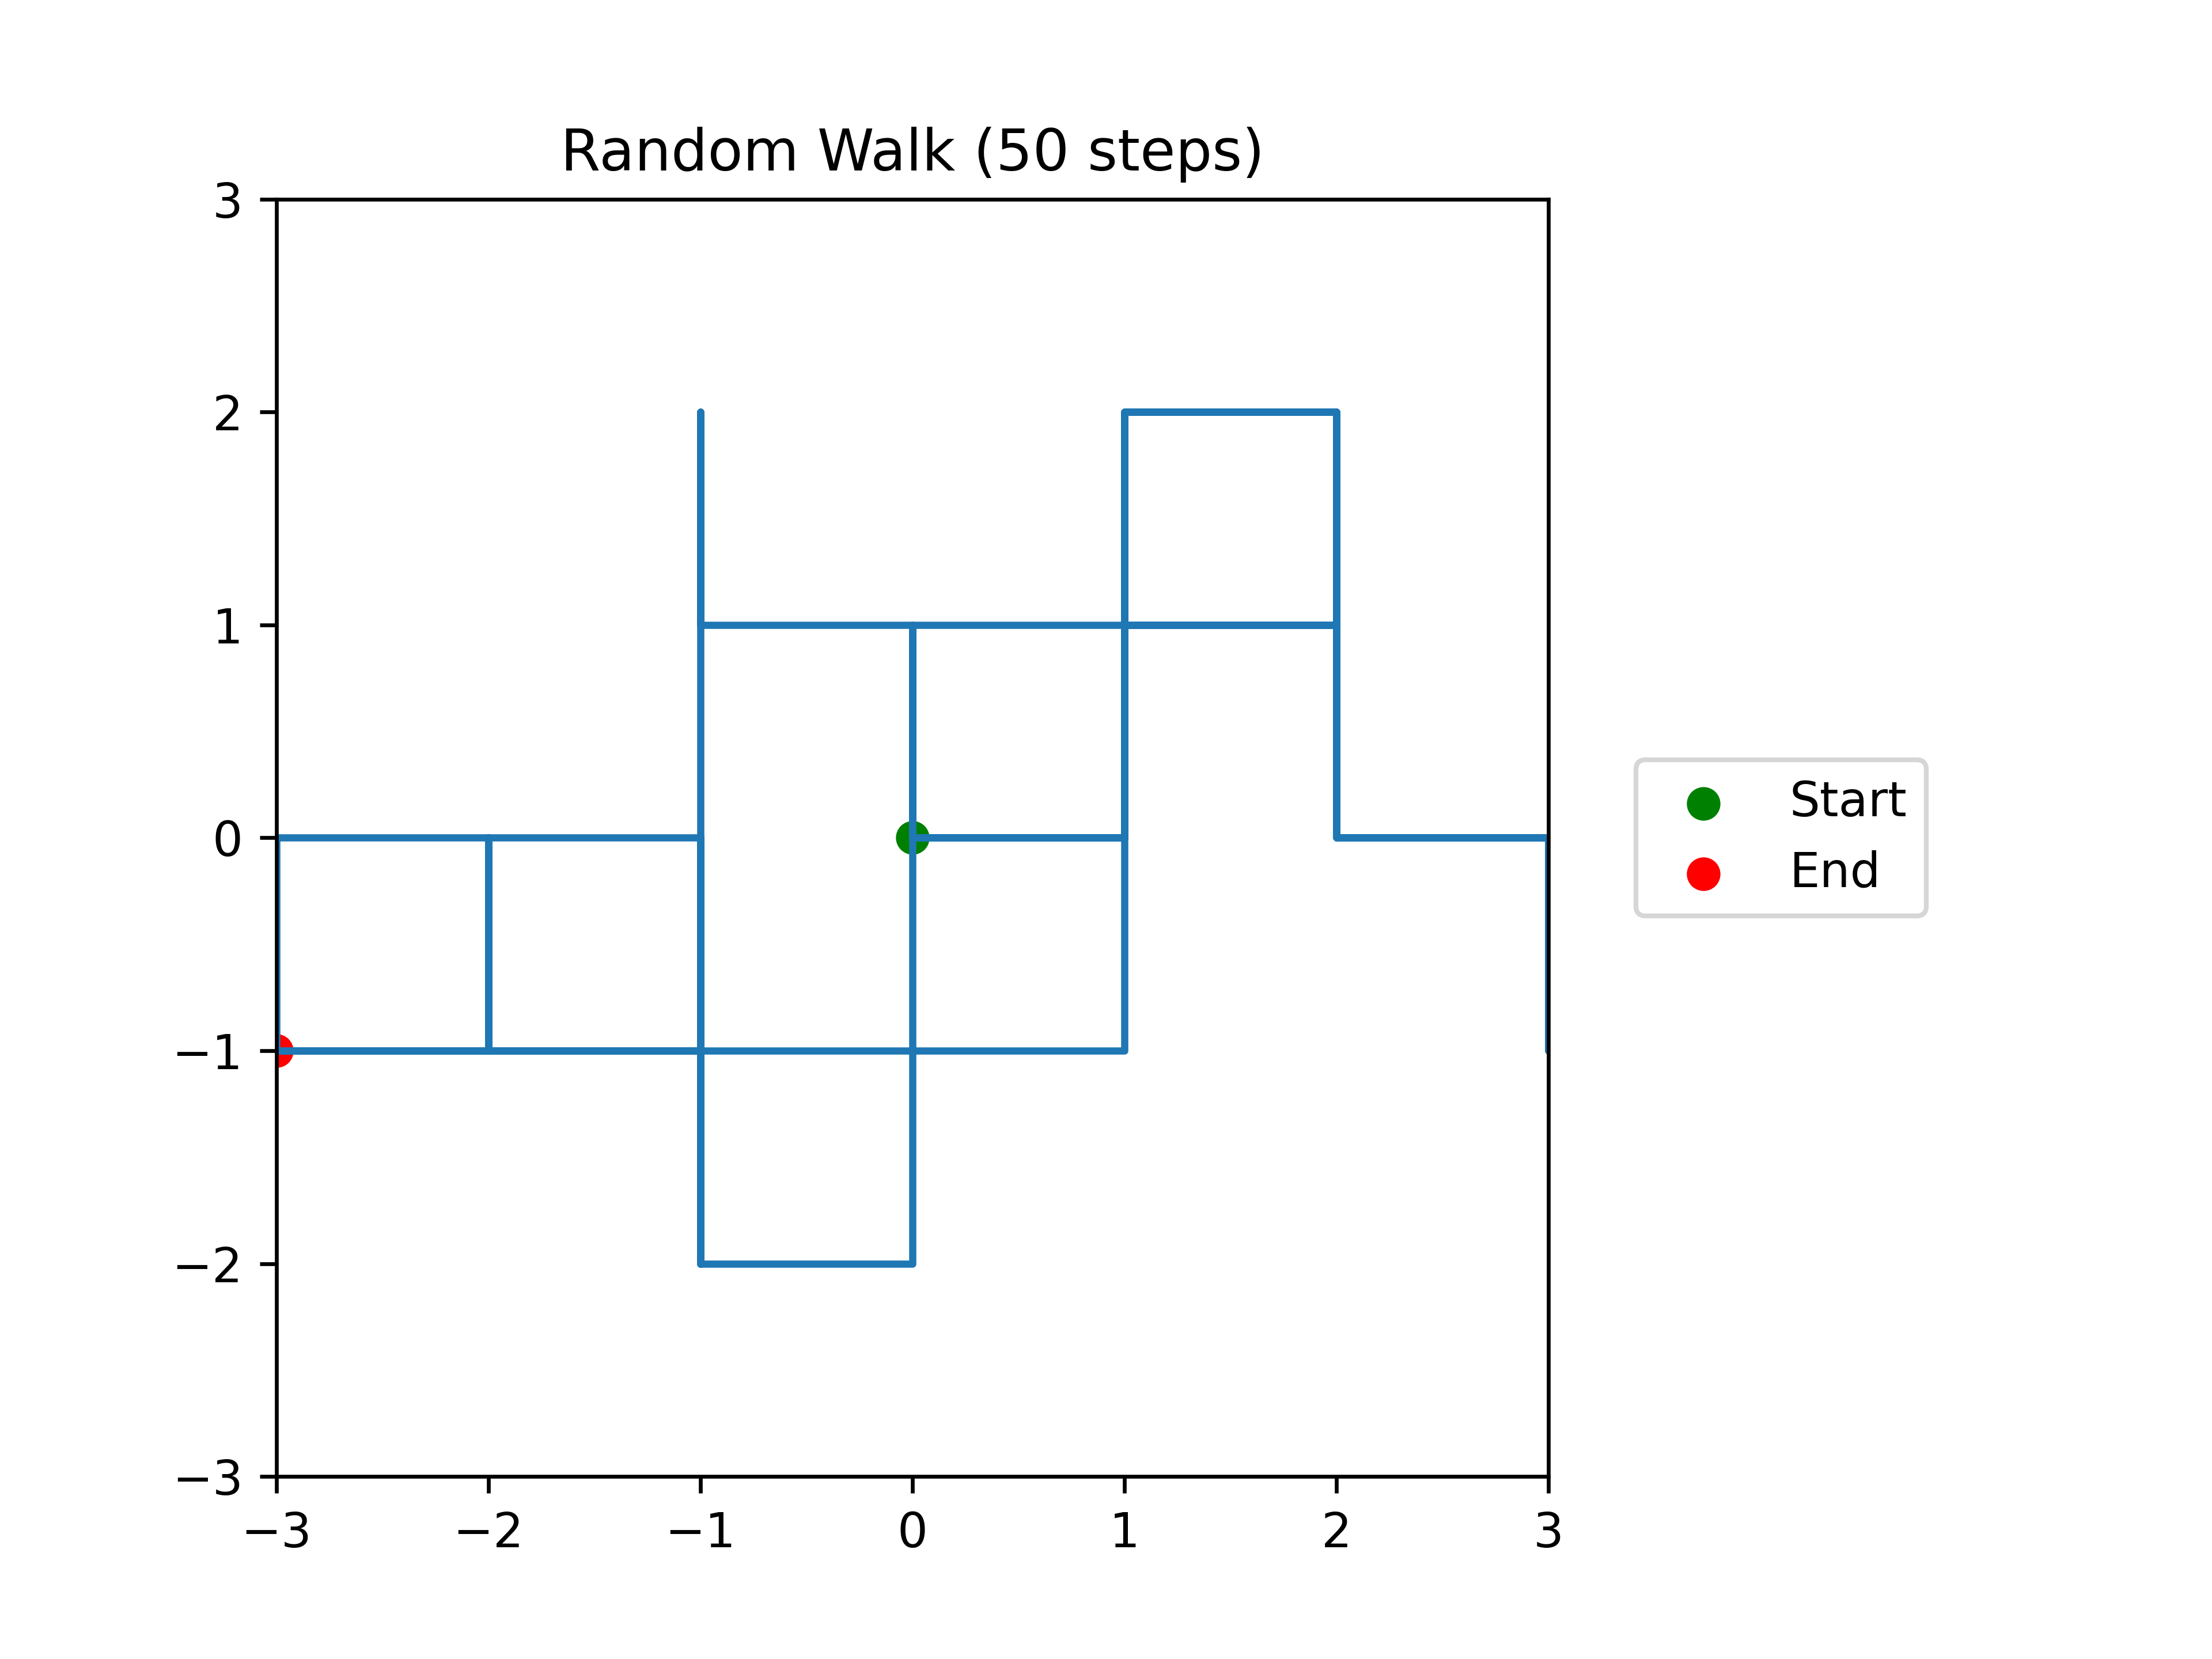
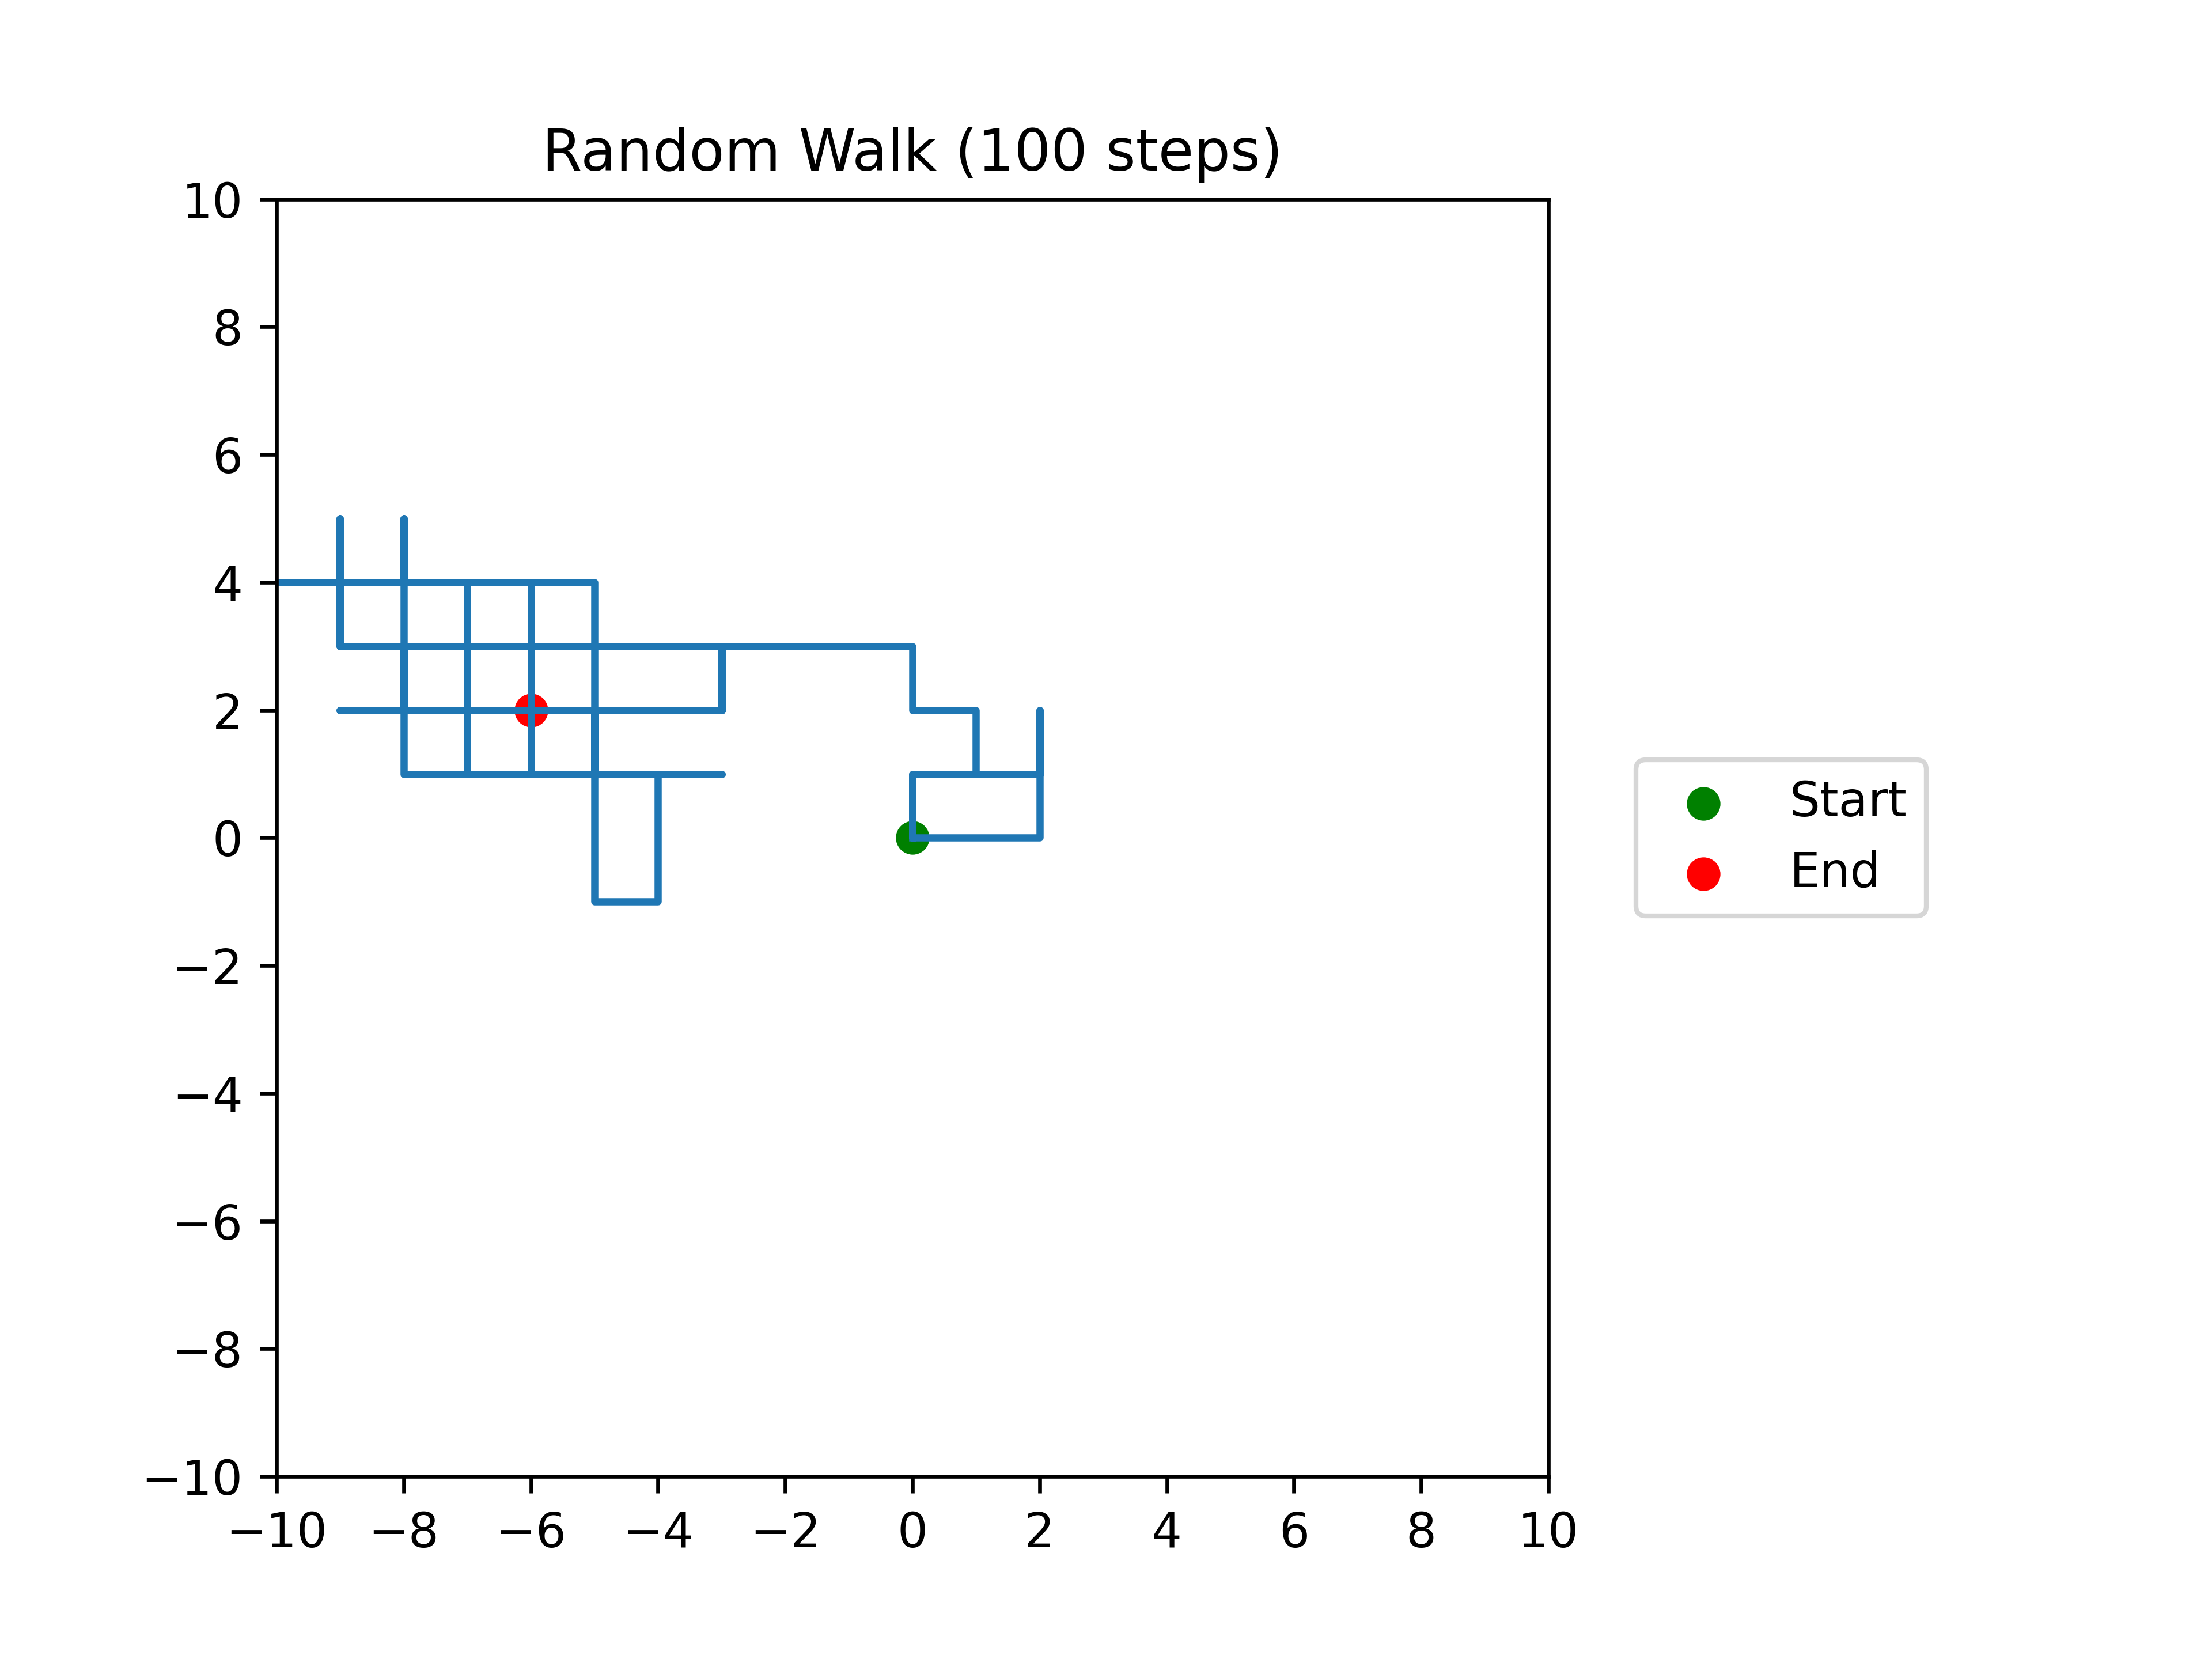
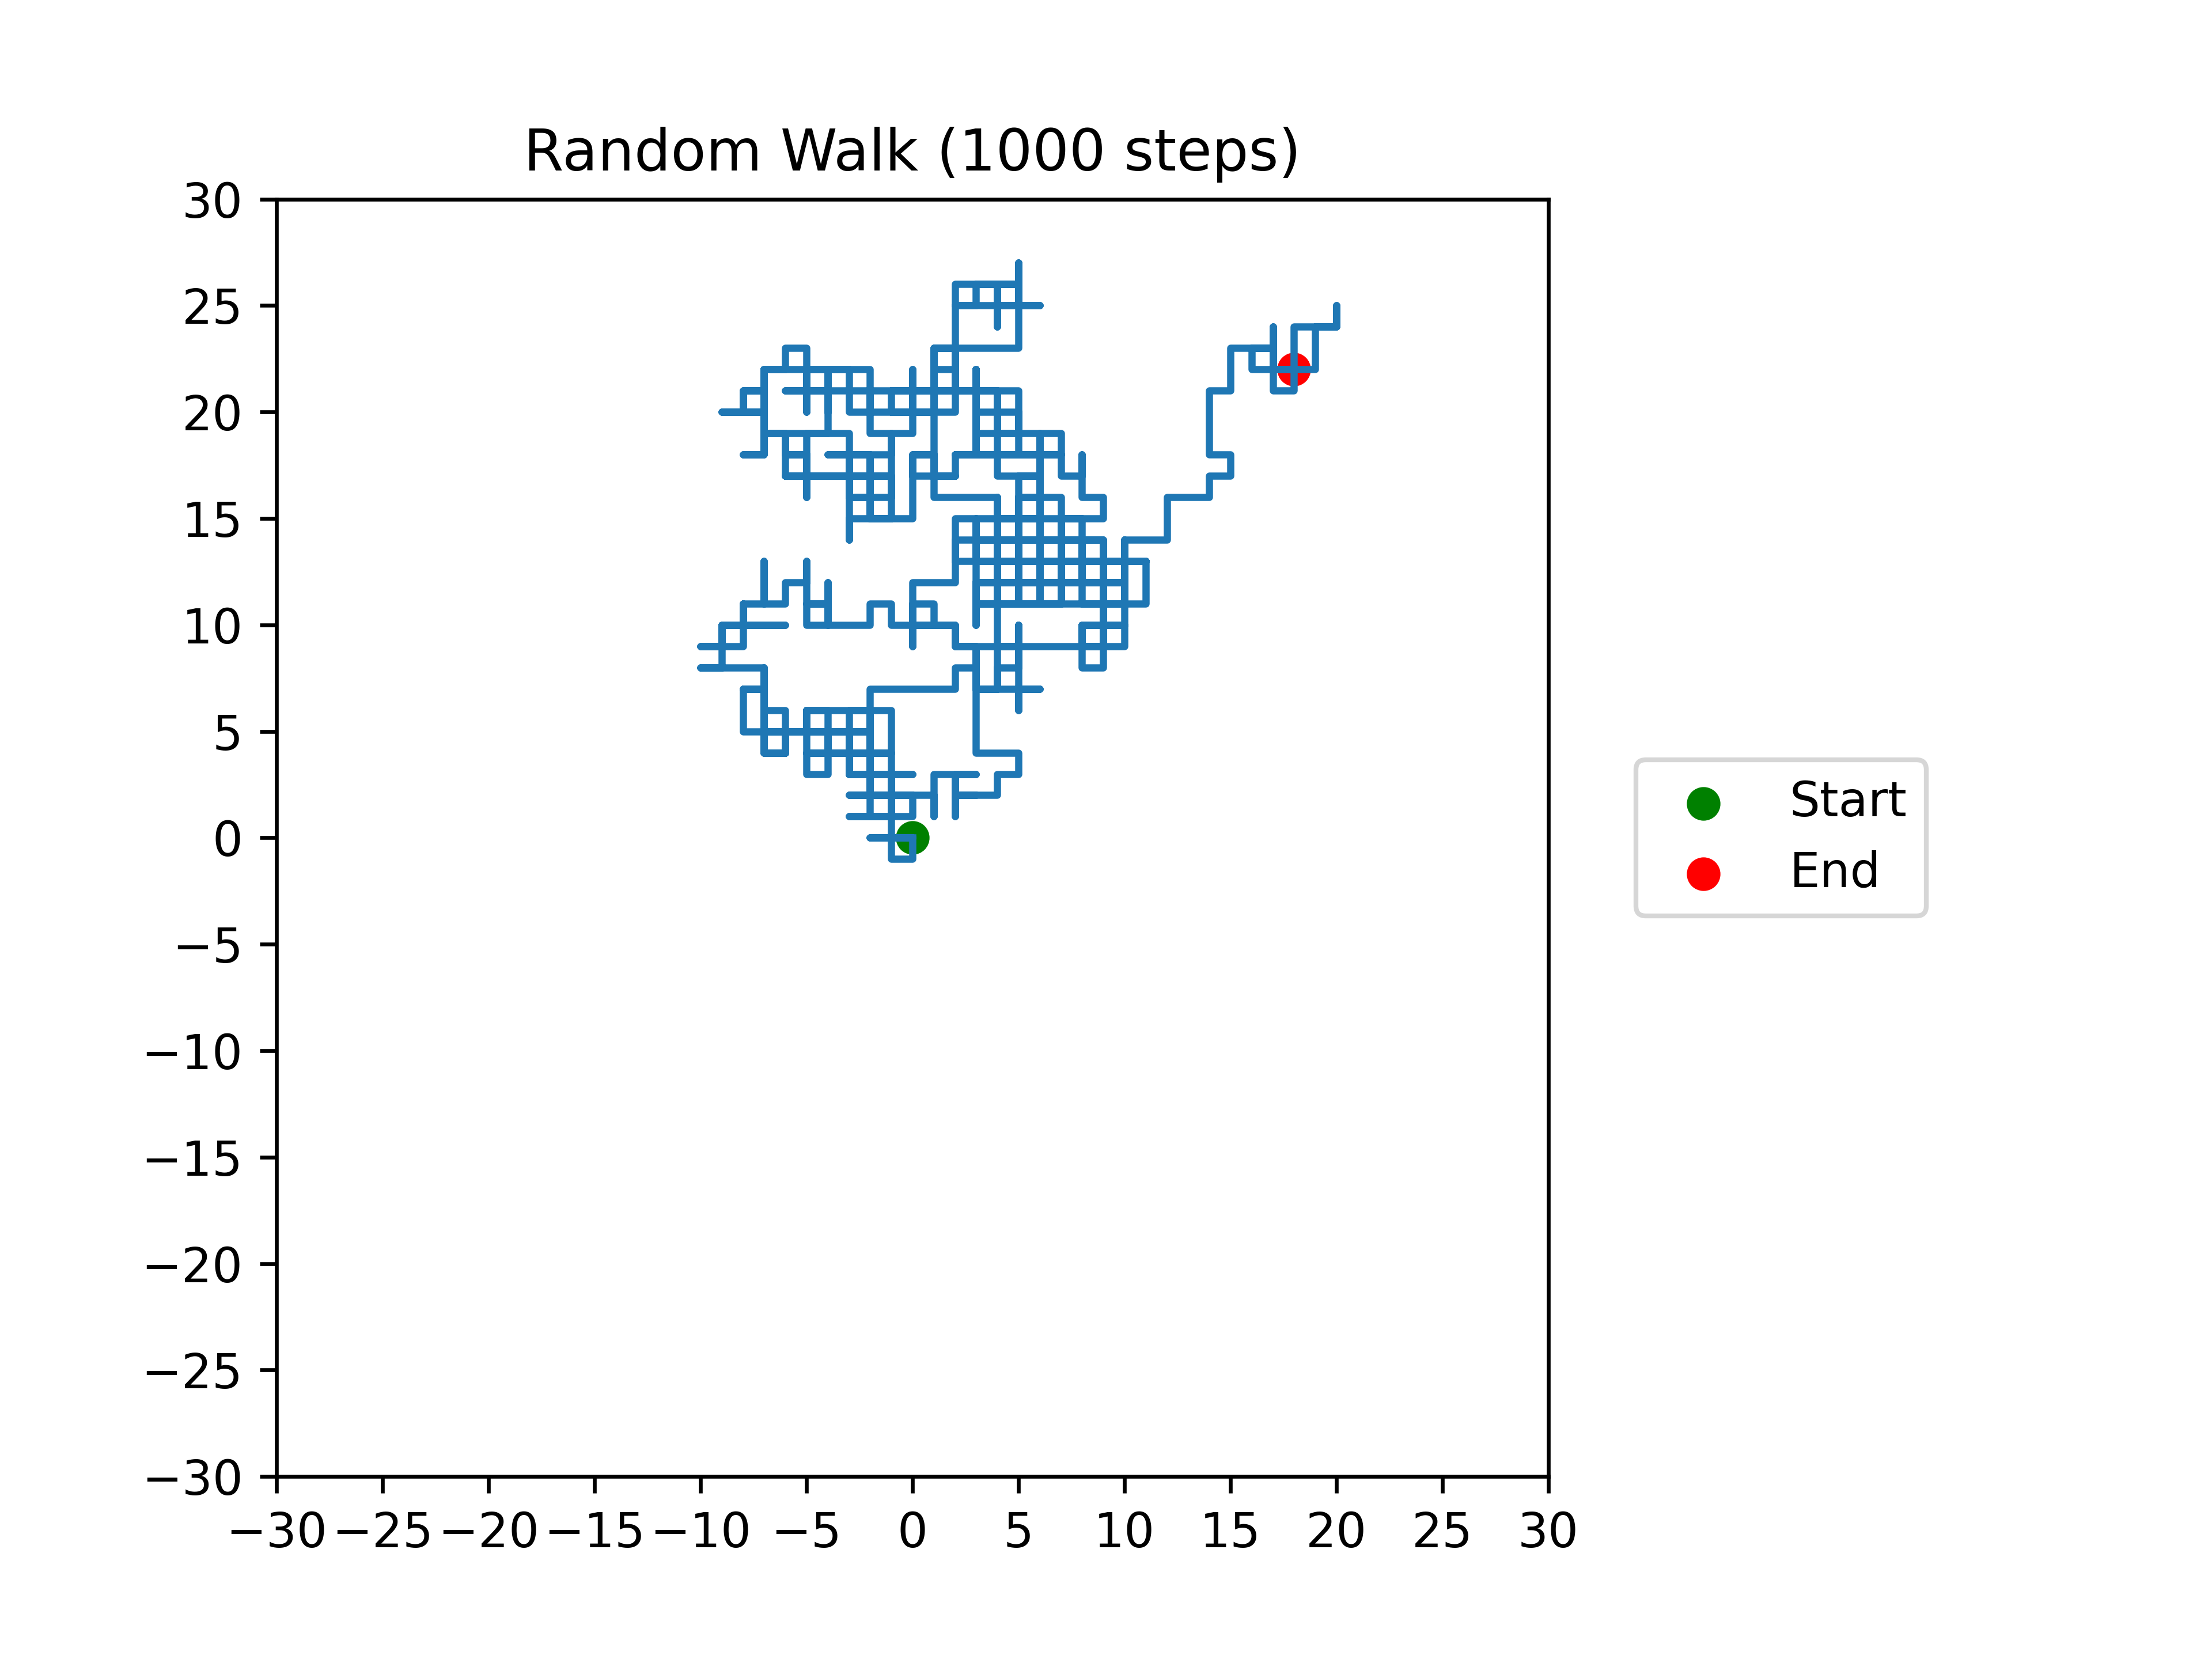
1.3. 2D walk plot
The code below simulates a 2D random walk.
1import matplotlib.pyplot as plt
2import random
3from pathlib import Path
4
5currfile_dir = Path(__file__).parent
6
7
8def random_walk(n):
9 """
10 Simulate a 2D random walk of `n` steps.
11
12 Parameters:
13 n (int): The number of steps in the random walk.
14
15 Returns:
16 list: The list of (x, y) coordinates visited during the walk.
17 """
18 x, y = 0, 0
19 coords = [(x, y)]
20 for _ in range(n):
21 (dx, dy) = random.choice([(0, 1), (0, -1), (1, 0), (-1, 0)])
22 x += dx
23 y += dy
24 coords.append((x, y))
25 return coords
26
27
28def plot_walk(coords):
29 """
30 Plot the path of a 2D random walk.
31
32 Parameters:
33 coords (list): The list of (x, y) coordinates visited during the walk.
34 """
35 x_coords = [x for x, y in coords]
36 y_coords = [y for x, y in coords]
37 plt.plot(x_coords, y_coords)
38 plt.scatter(x_coords[0], y_coords[0], color="green", label="Start")
39 plt.scatter(x_coords[-1], y_coords[-1], color="red", label="End")
40
41 max_coord = max(max(map(abs, x_coords)), max(map(abs, y_coords)))
42
43 if max_coord > 30:
44 max_coord = max_coord + (-max_coord % 10)
45 ticks = range(-max_coord, max_coord + 1, 10)
46
47 elif max_coord > 16:
48 max_coord = max_coord + (-max_coord % 5)
49 ticks = range(-max_coord, max_coord + 1, 5)
50
51 elif max_coord > 8:
52 max_coord = max_coord + (-max_coord % 2)
53 ticks = range(-max_coord, max_coord + 1, 2)
54
55 else:
56 ticks = range(-max_coord, max_coord + 1)
57
58 plt.xticks(ticks)
59 plt.yticks(ticks)
60
61 plt.xlim(-max_coord, max_coord)
62 plt.ylim(-max_coord, max_coord)
63
64 plt.legend(loc='center left', bbox_to_anchor=(1.05, 0.5))
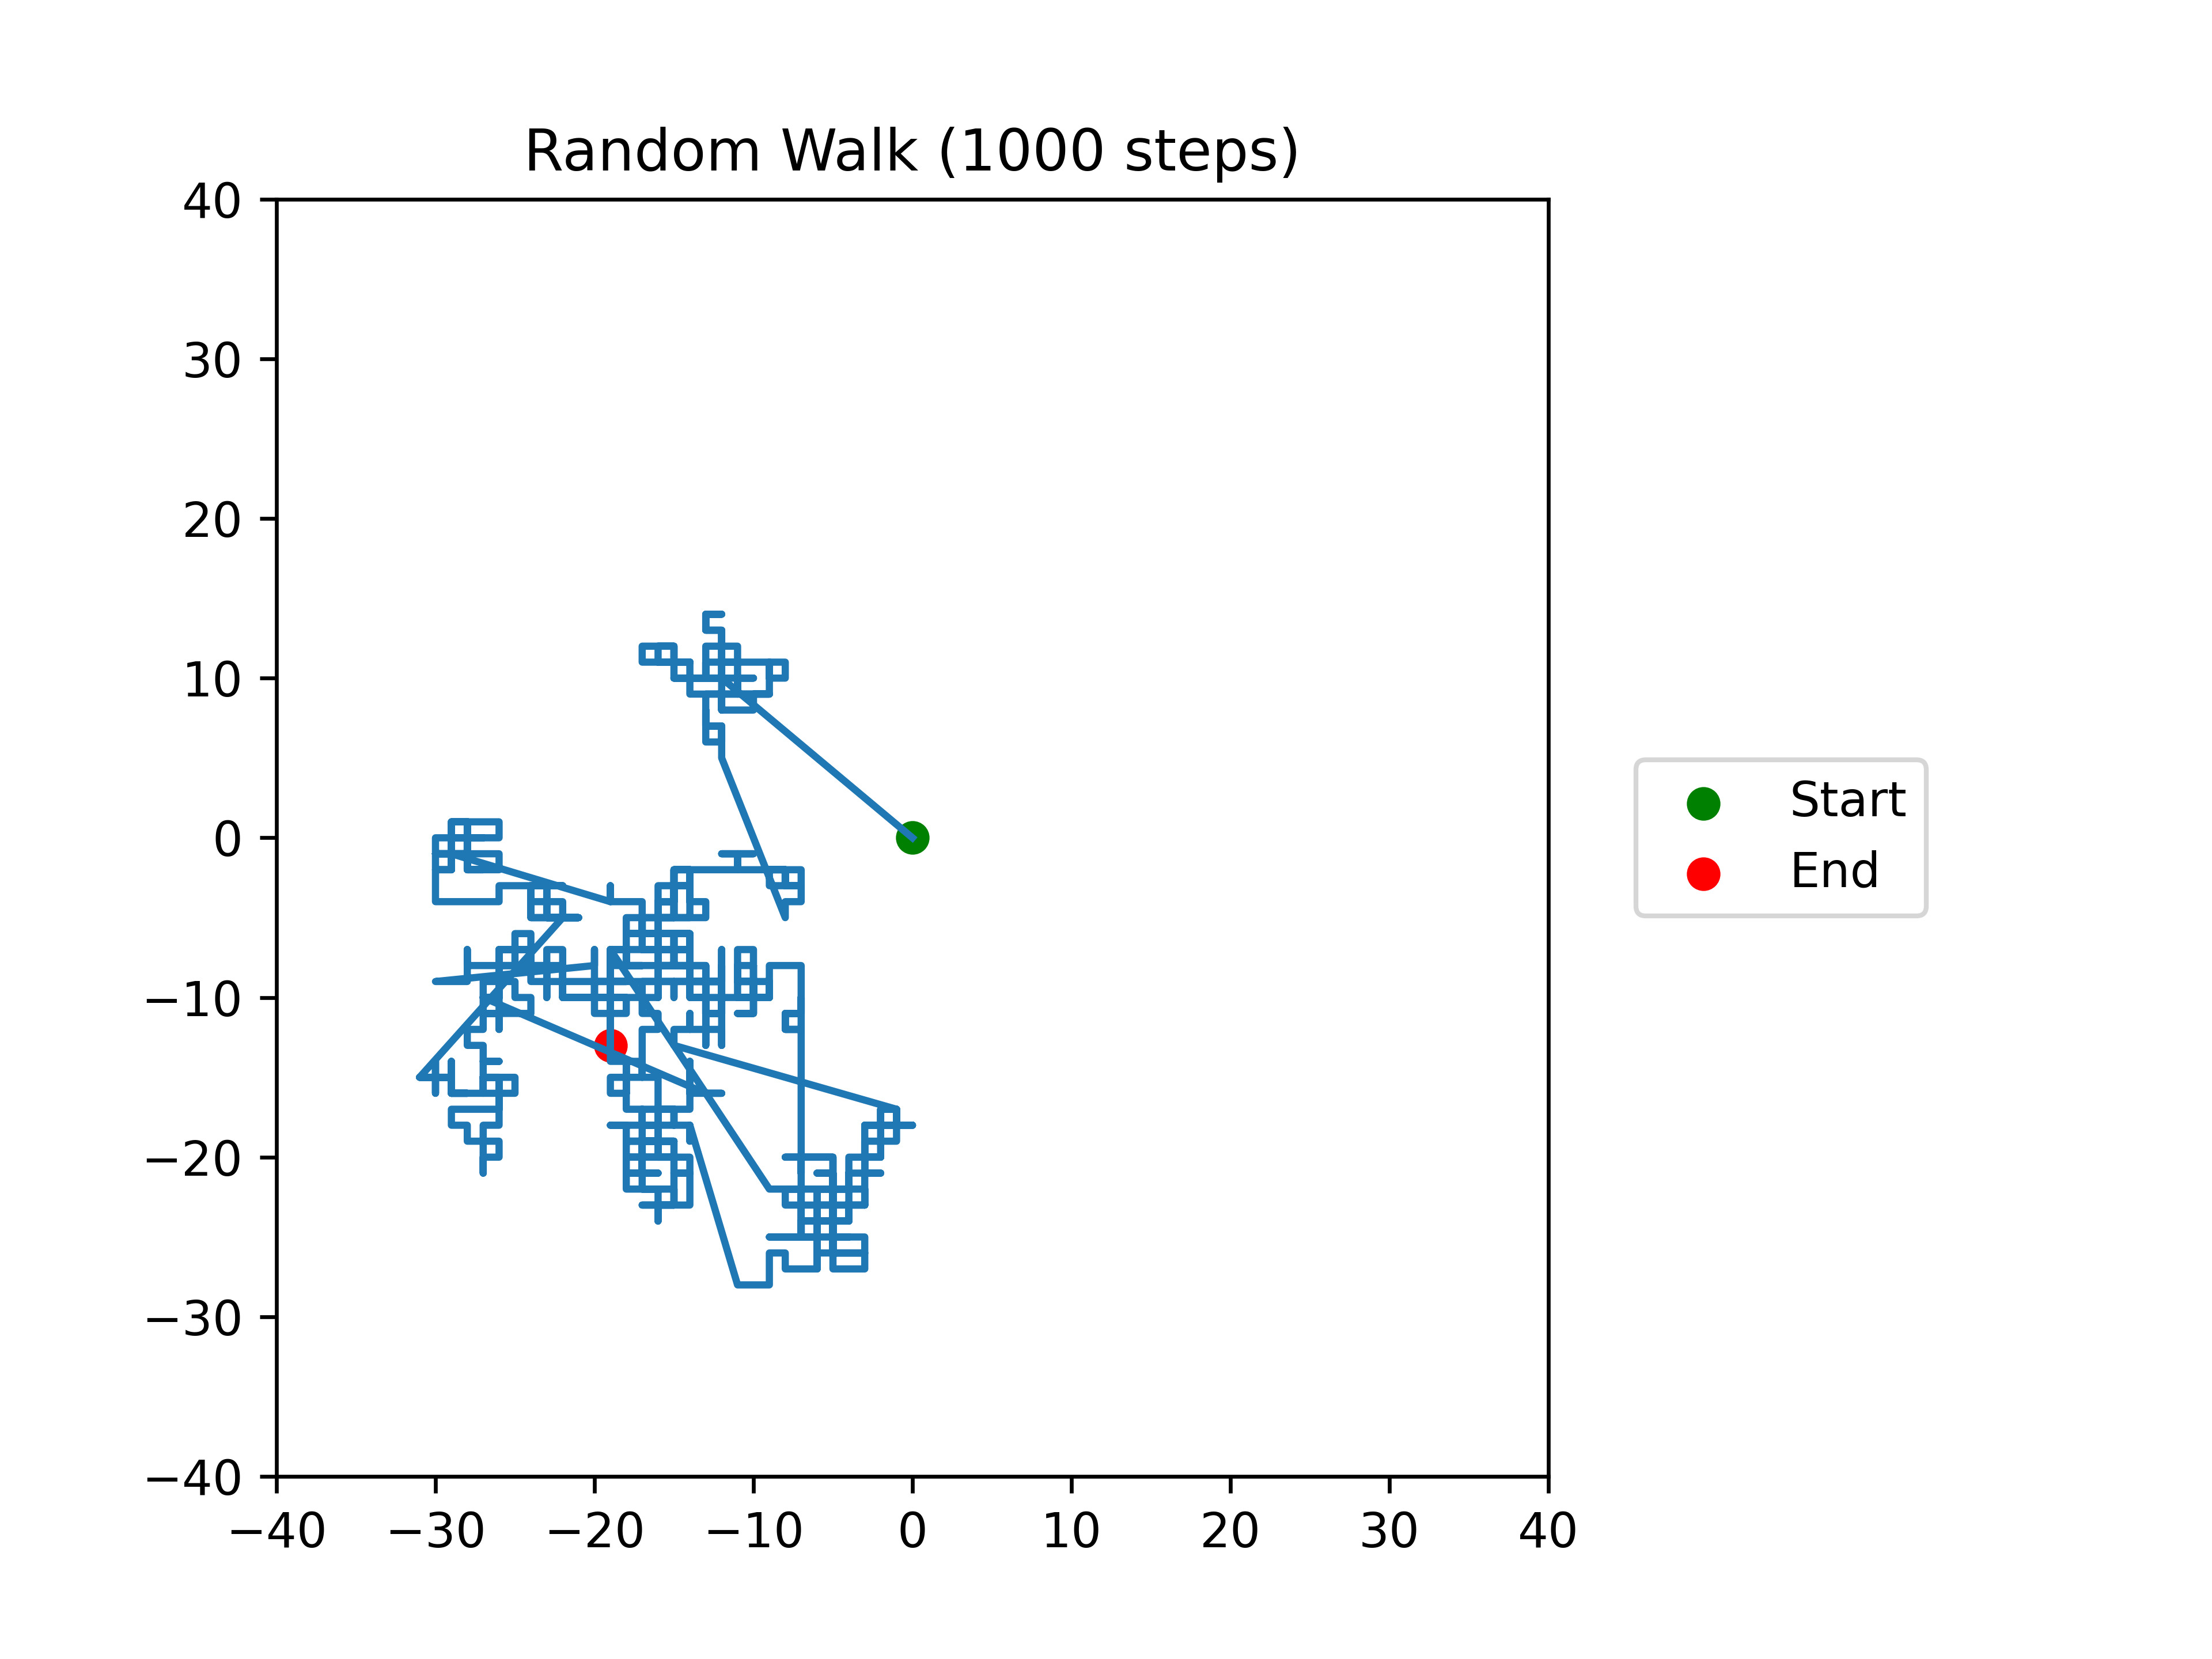
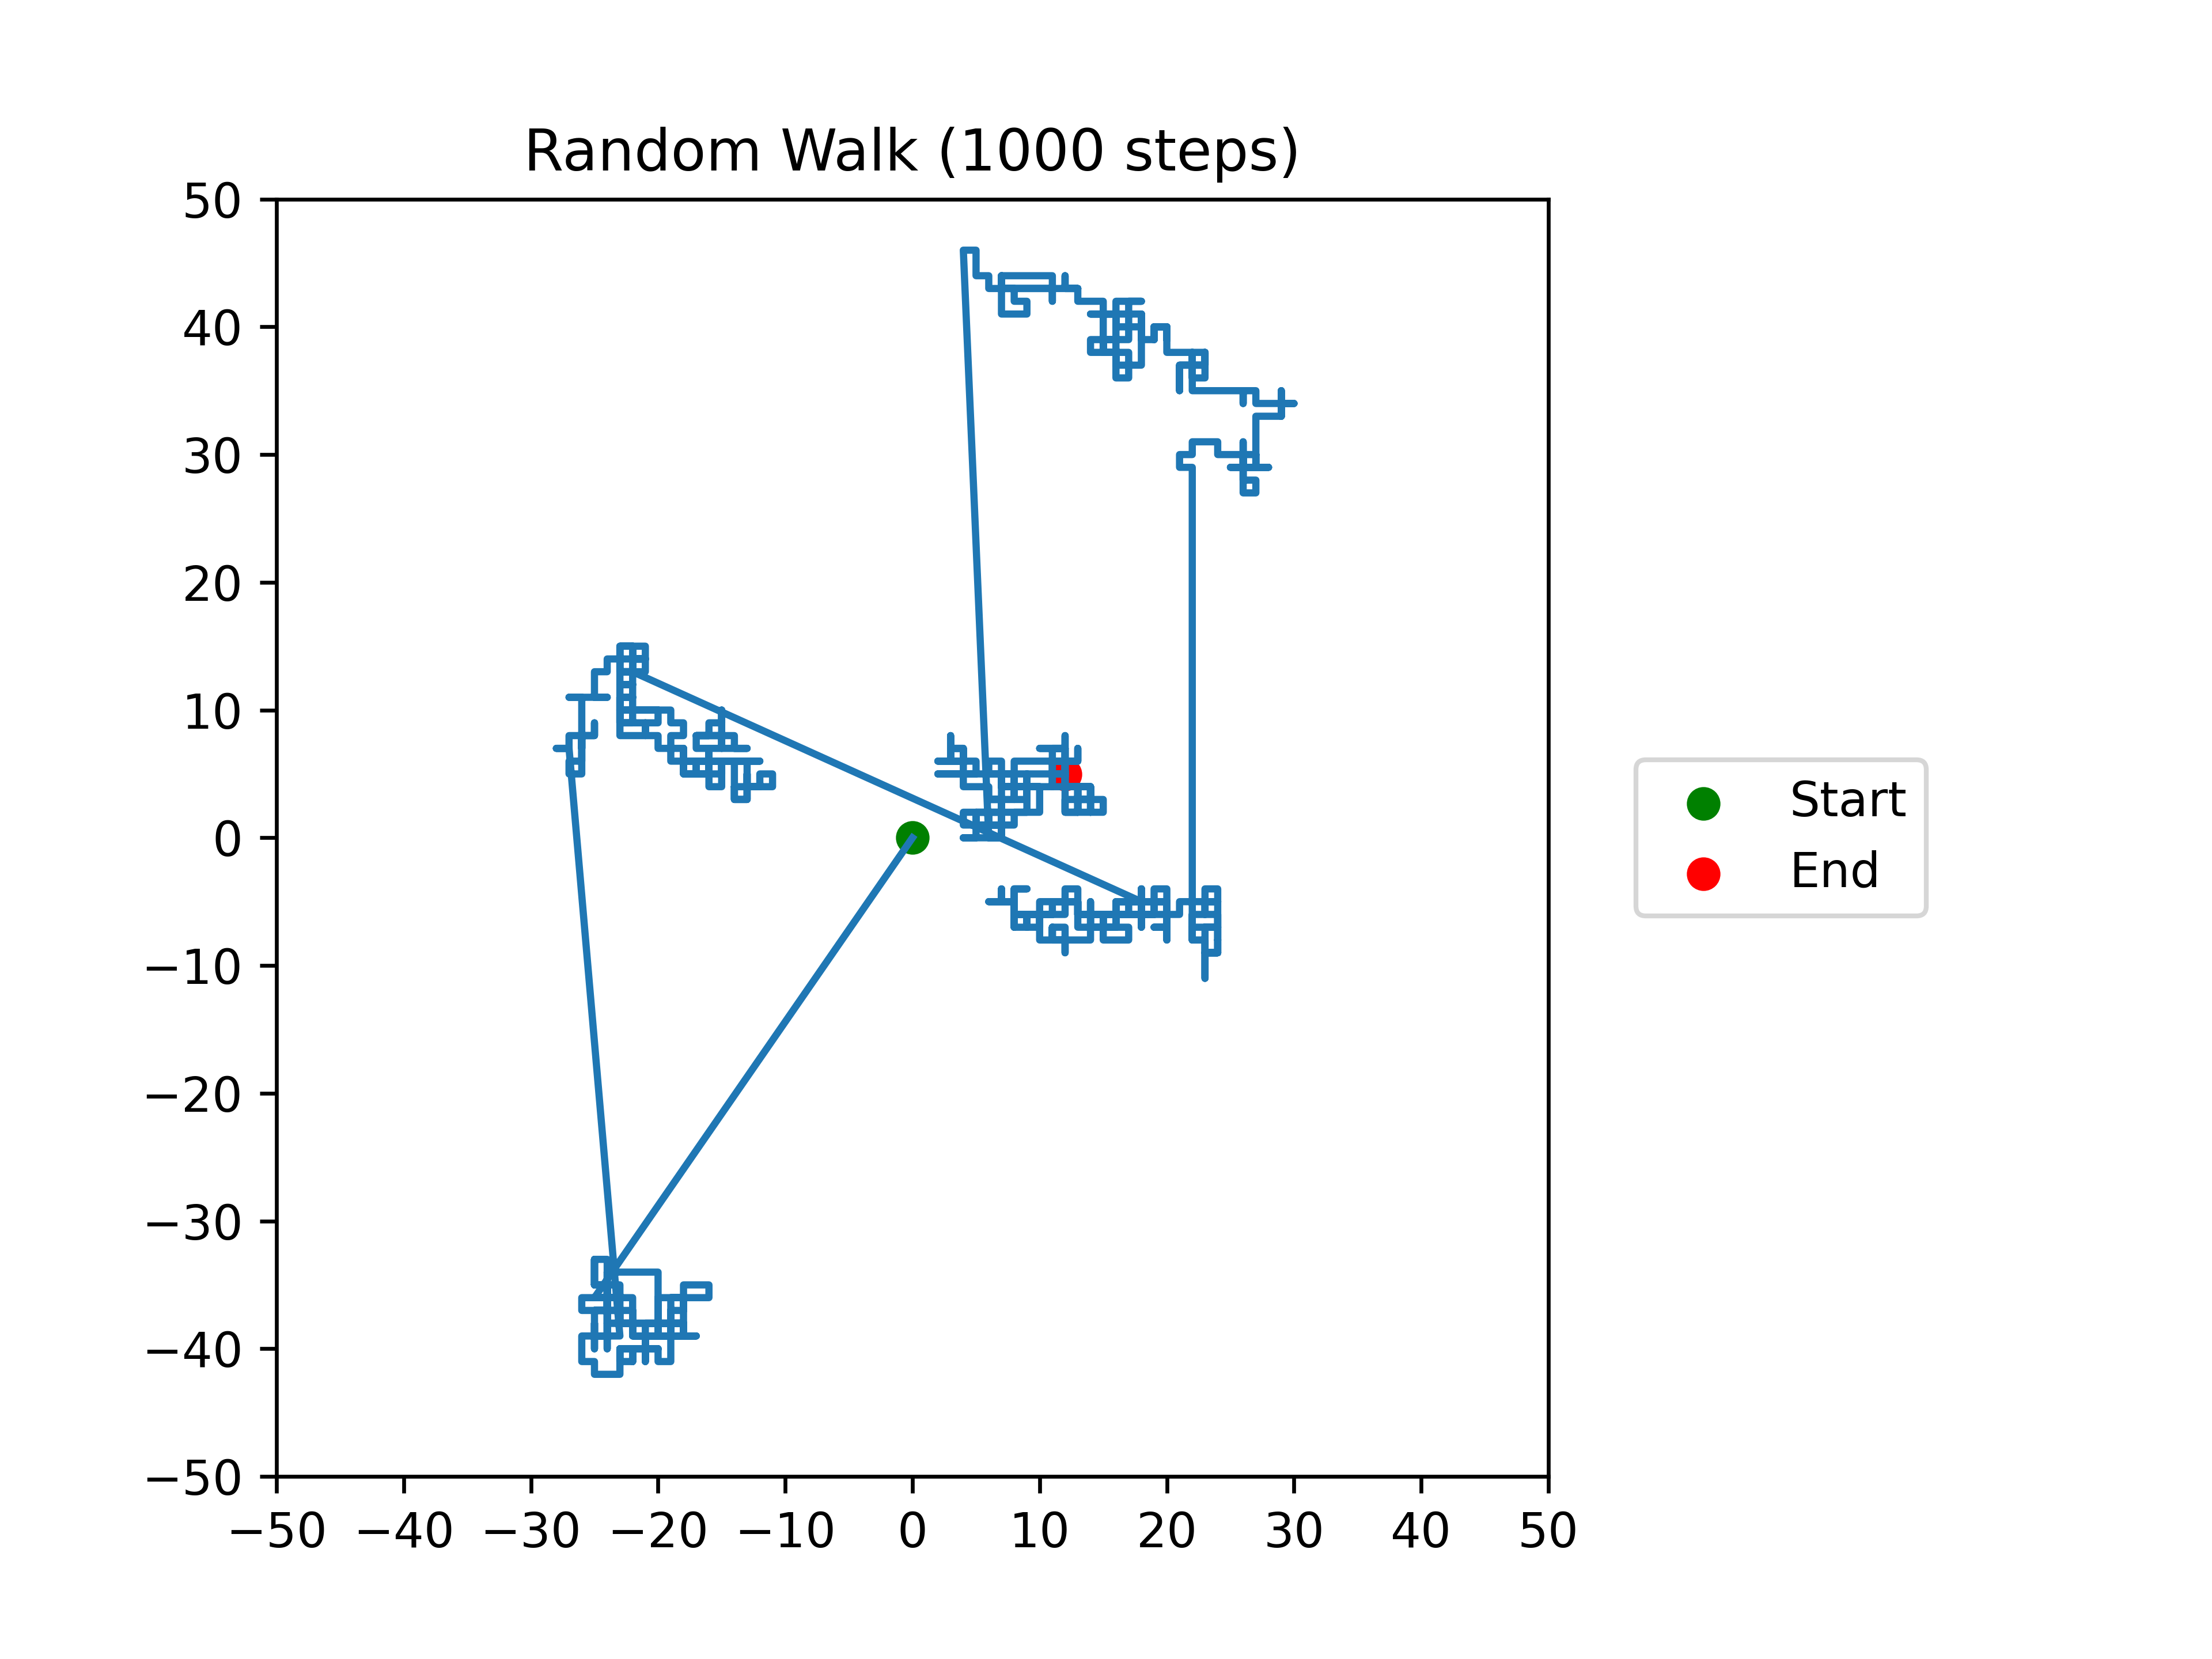
65 plt.title(f"Random Walk ({len(coords)-1} steps)")
66 plt.subplots_adjust(right=0.7)
67
68 save_plot(plt, f'random_walks_2D_{len(coords)-1}_steps')
69
70 plt.show()
71
72
73def save_plot(plot, filename):
74 """
75 Saves the given plot to a file with the given filename within the curr directory
76 """
77 filepath = currfile_dir / filename
78 plot.savefig(filepath, dpi=600)
79
80
81# Example usage:
82coords = random_walk(10)
83plot_walk(coords)
84coords = random_walk(50)
85plot_walk(coords)
86coords = random_walk(100)
87plot_walk(coords)
88coords = random_walk(1000)
89plot_walk(coords)
Examples 2D walks are below:
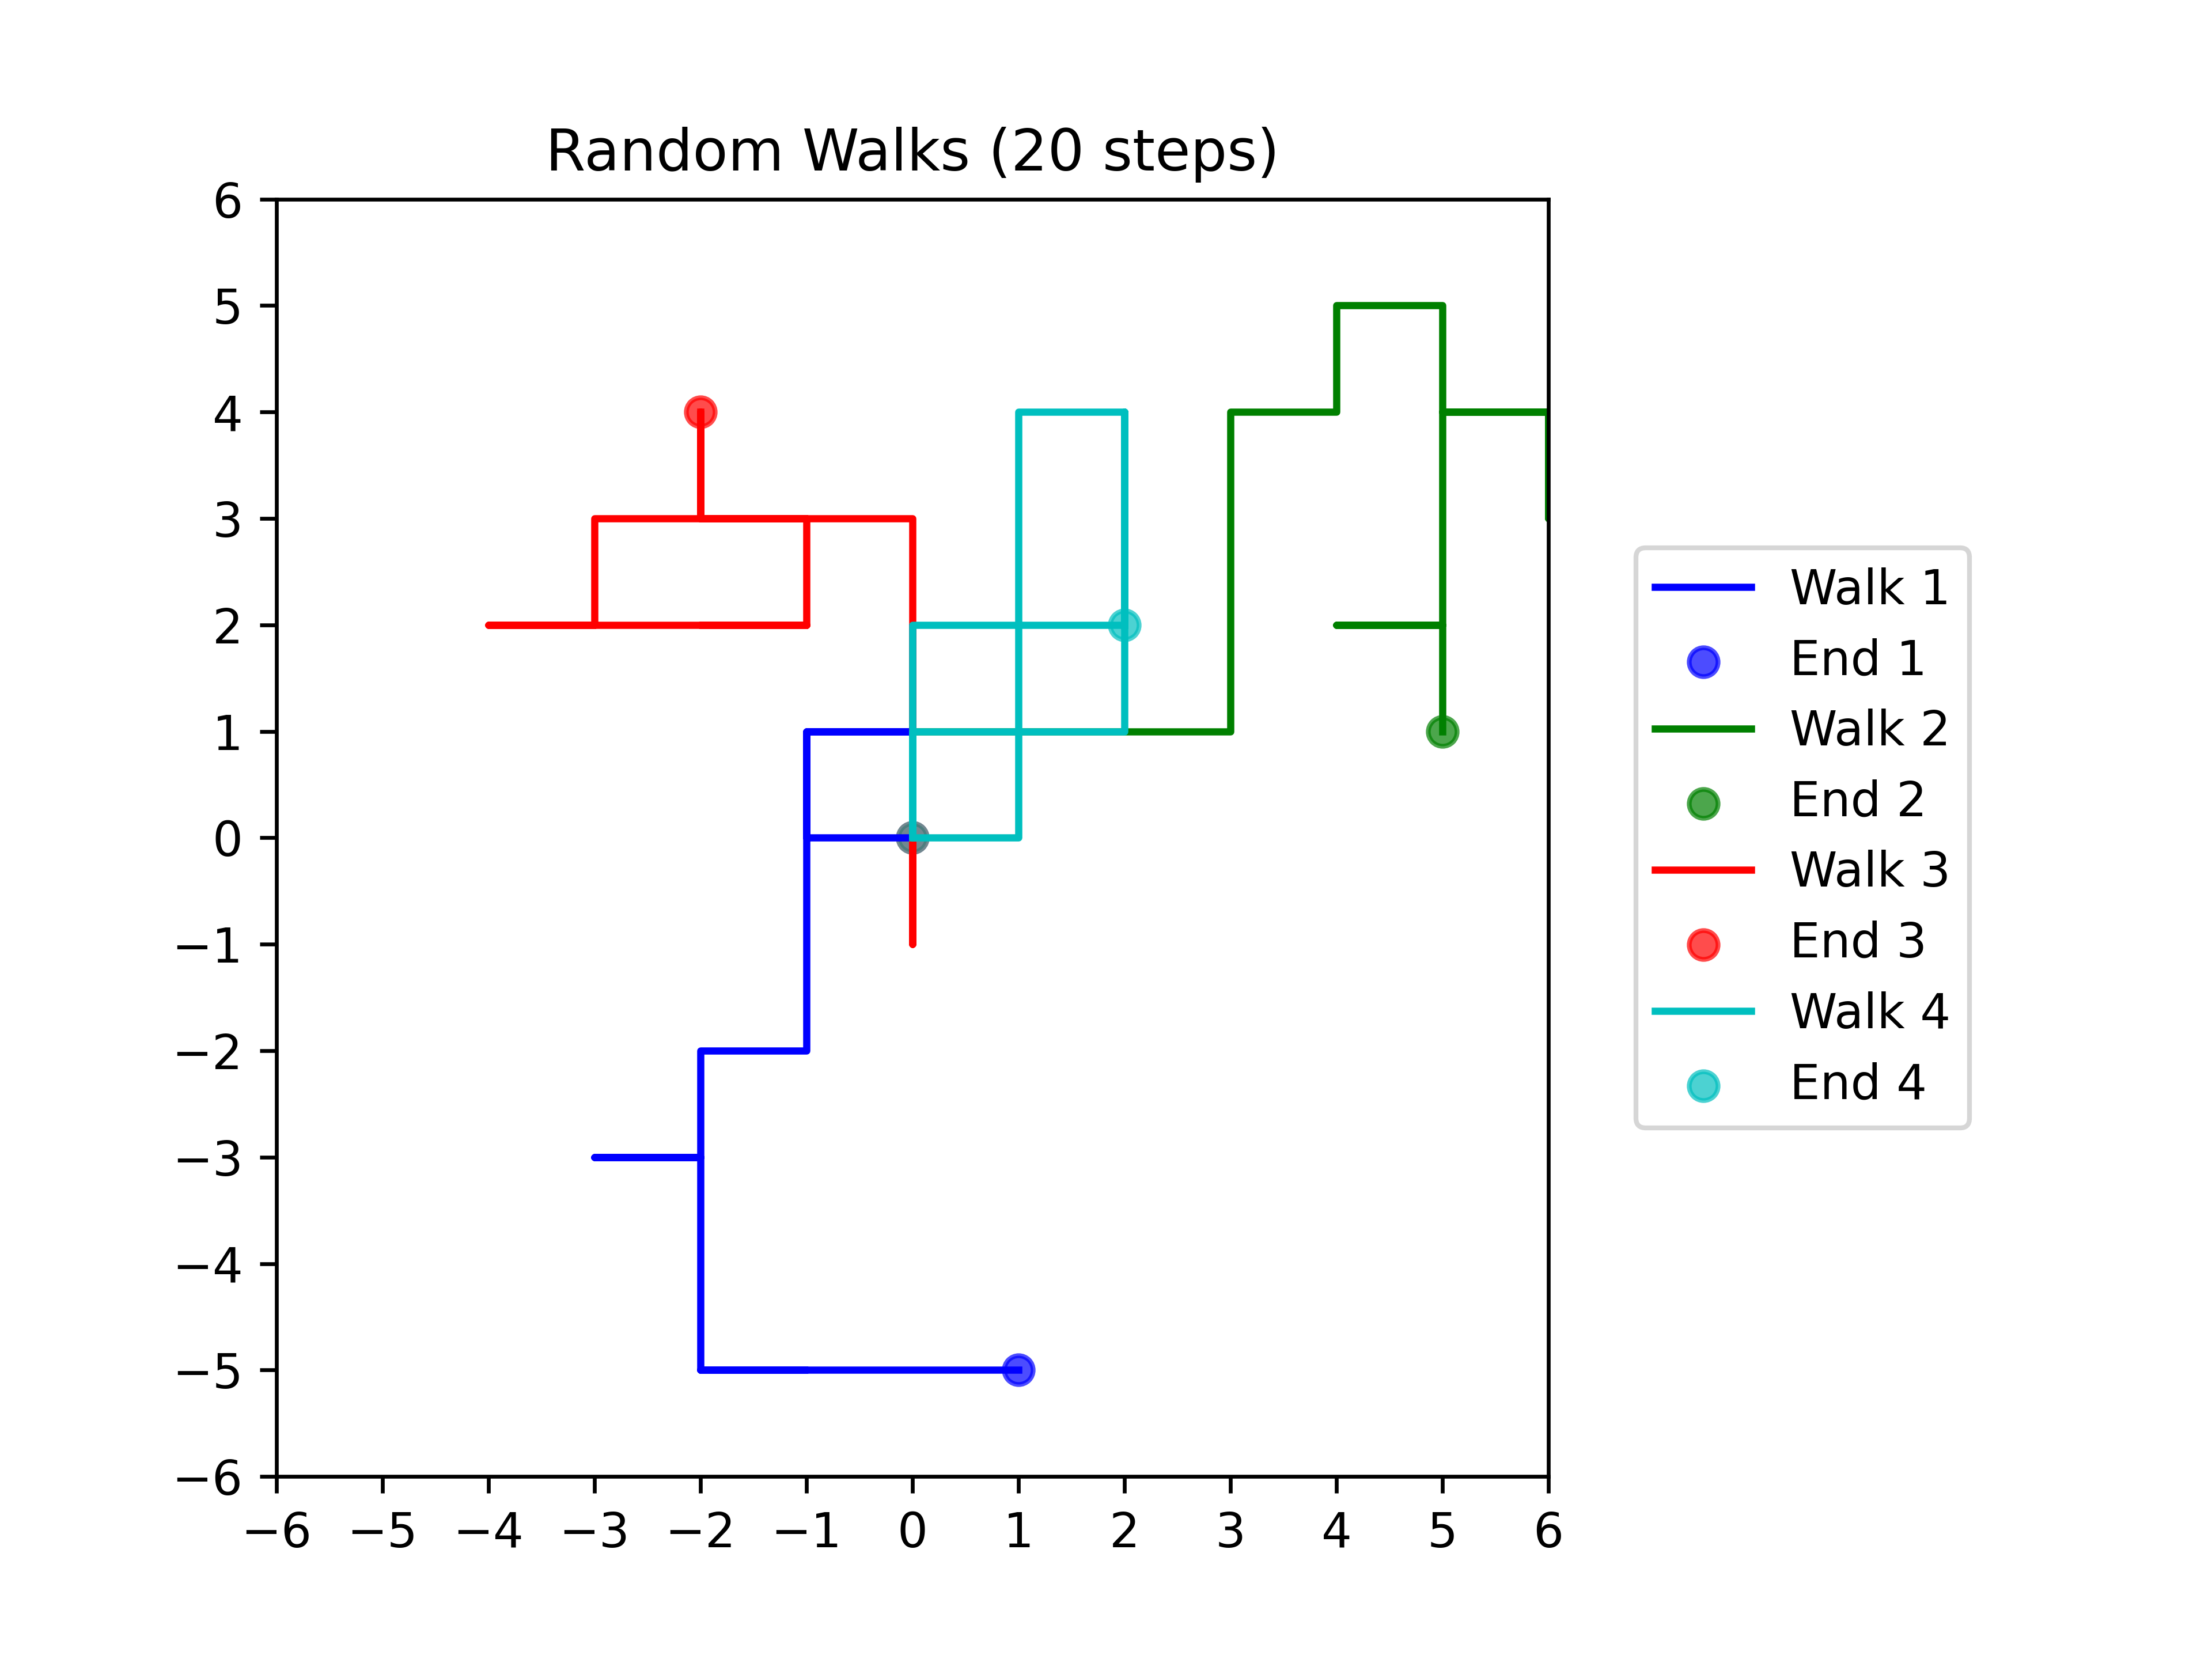
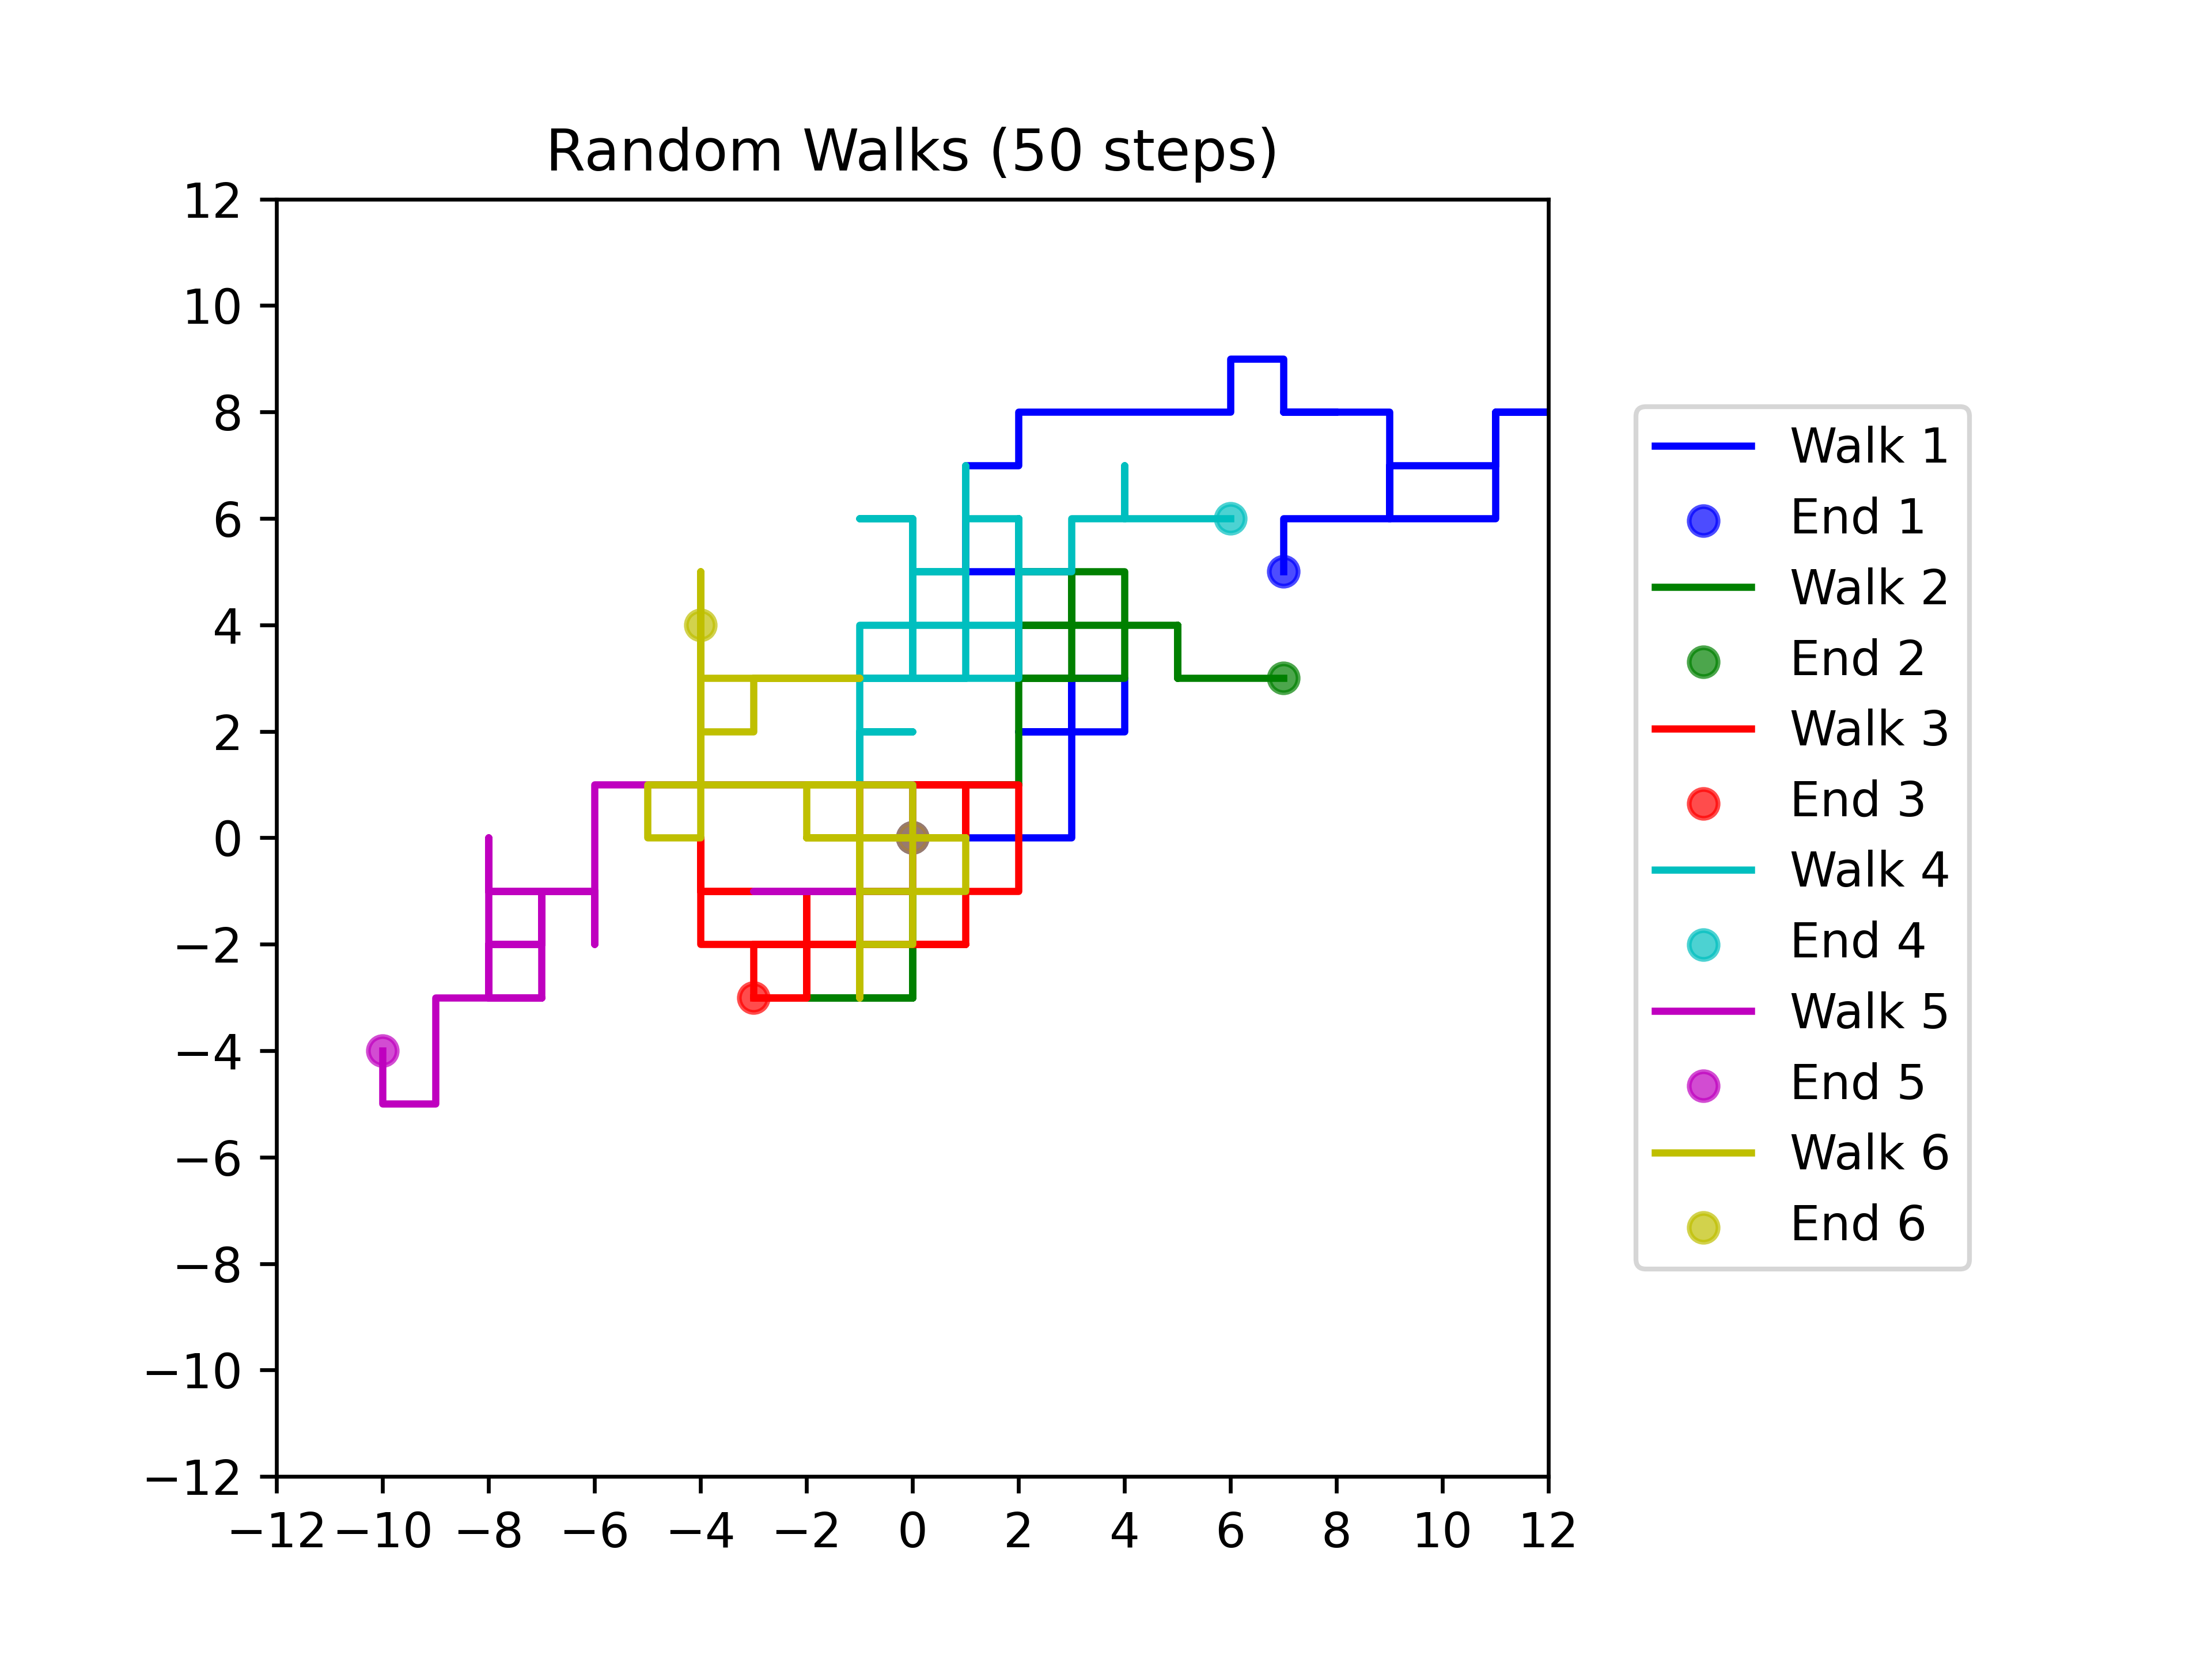
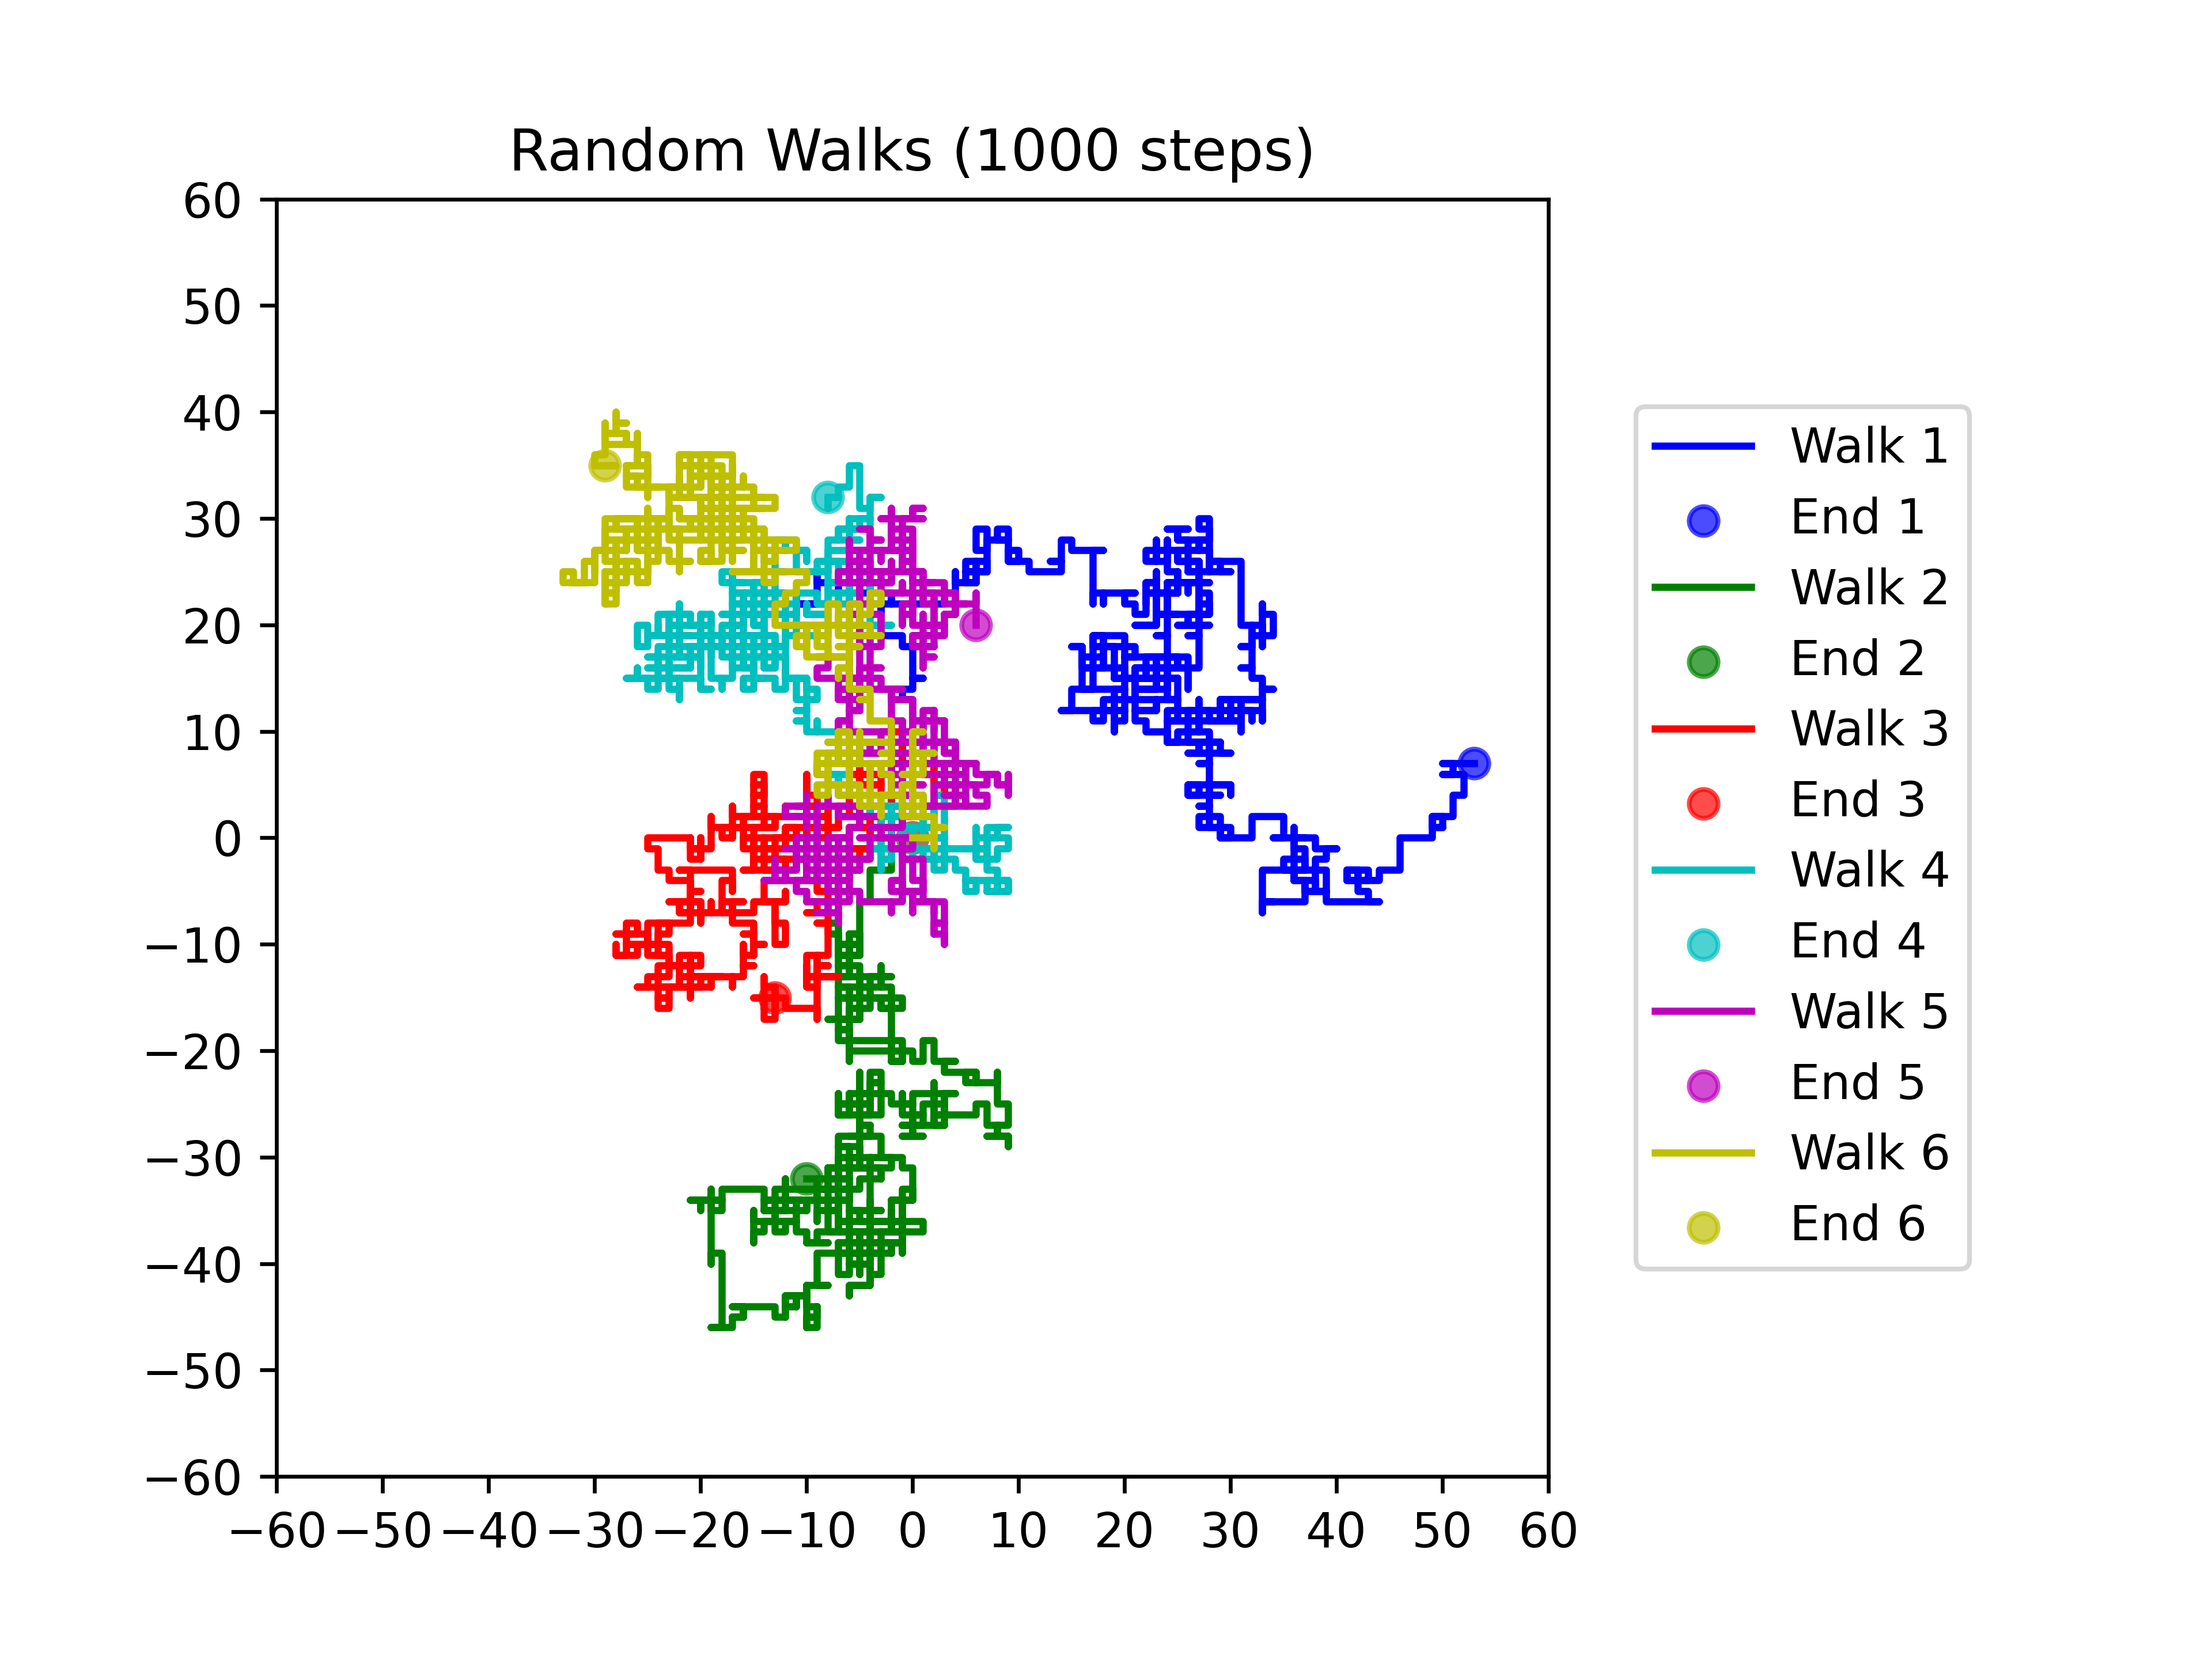
The code below simulates a multiple 2D random walks suitable for 2 to 6 walks.
 1import matplotlib.pyplot as plt
 2from matplotlib.colors import to_rgba
 3import random
 4from pathlib import Path
 5
 6currfile_dir = Path(__file__).parent
 7
 8
 9def random_walk(n):
10    """
11    Simulate a 2D random walk of `n` steps.
12
13    Parameters:
14    n (int): The number of steps in the random walk.
15
16    Returns:
17    list: The list of (x, y) coordinates visited during the walk.
18    """
19    x, y = 0, 0
20    coords = [(x, y)]
21    for _ in range(n):
22        (dx, dy) = random.choice([(0, 1), (0, -1), (1, 0), (-1, 0)])
23        x += dx
24        y += dy
25        coords.append((x, y))
26    return coords
27
28def plot_walks(walks):
29    """
30    Plot the paths of multiple 2D random walks.
31
32    Parameters:
33    walks (list): A list of lists of (x, y) coordinates visited during each walk.
34    """
35    colors = ['b', 'g', 'r', 'c', 'm', 'y', 'k']
36    max_coord = 0
37    for i, coords in enumerate(walks):
38        color = colors[i % len(colors)]
39        x_coords = [x for x, y in coords]
40        y_coords = [y for x, y in coords]
41        plt.plot(x_coords, y_coords, color=color, label=f'Walk {i+1}')
42        start_color = to_rgba(color)
43        end_color = to_rgba(color)
44        plt.scatter(x_coords[0], y_coords[0], color=start_color[:3] + (0.3,))
45        plt.scatter(x_coords[-1], y_coords[-1], color=end_color[:3] + (0.7,), label=f'End {i+1}')
46        max_coord = max(max_coord, max(map(abs, x_coords)), max(map(abs, y_coords)))
47
48    if max_coord > 30:
49        max_coord = max_coord + (-max_coord % 10)
50        ticks = range(-max_coord, max_coord + 1, 10)
51
52    elif max_coord > 16:
53        max_coord = max_coord + (-max_coord % 5)
54        ticks = range(-max_coord, max_coord + 1, 5)
55
56    elif max_coord > 8:
57        max_coord = max_coord + (-max_coord % 2)
58        ticks = range(-max_coord, max_coord + 1, 2)
59
60    else:
61        ticks = range(-max_coord, max_coord + 1)
62
63    plt.xticks(ticks)
64    plt.yticks(ticks)
65
66    plt.xlim(-max_coord, max_coord)
67    plt.ylim(-max_coord, max_coord)
68
69    plt.legend(loc='center left', bbox_to_anchor=(1.05, 0.5))
70    plt.title(f'Random Walks ({len(coords)-1} steps)')
71    plt.subplots_adjust(right=0.7)
72
73    save_plot(plt, f'random_walks_2D_multi_{len(coords)-1}_steps')
74
75    plt.show()
76
77
78def save_plot(plot, filename):
79    """
80    Saves the given plot to a file with the given filename within the curr directory
81    """
82    filepath = currfile_dir / filename
83    plot.savefig(filepath, dpi=600)
84
85
86# Example usage:
87walks = [random_walk(20) for _ in range(4)]
88plot_walks(walks)
89walks = [random_walk(50) for _ in range(6)]
90plot_walks(walks)
91walks = [random_walk(1000) for _ in range(6)]
92plot_walks(walks)
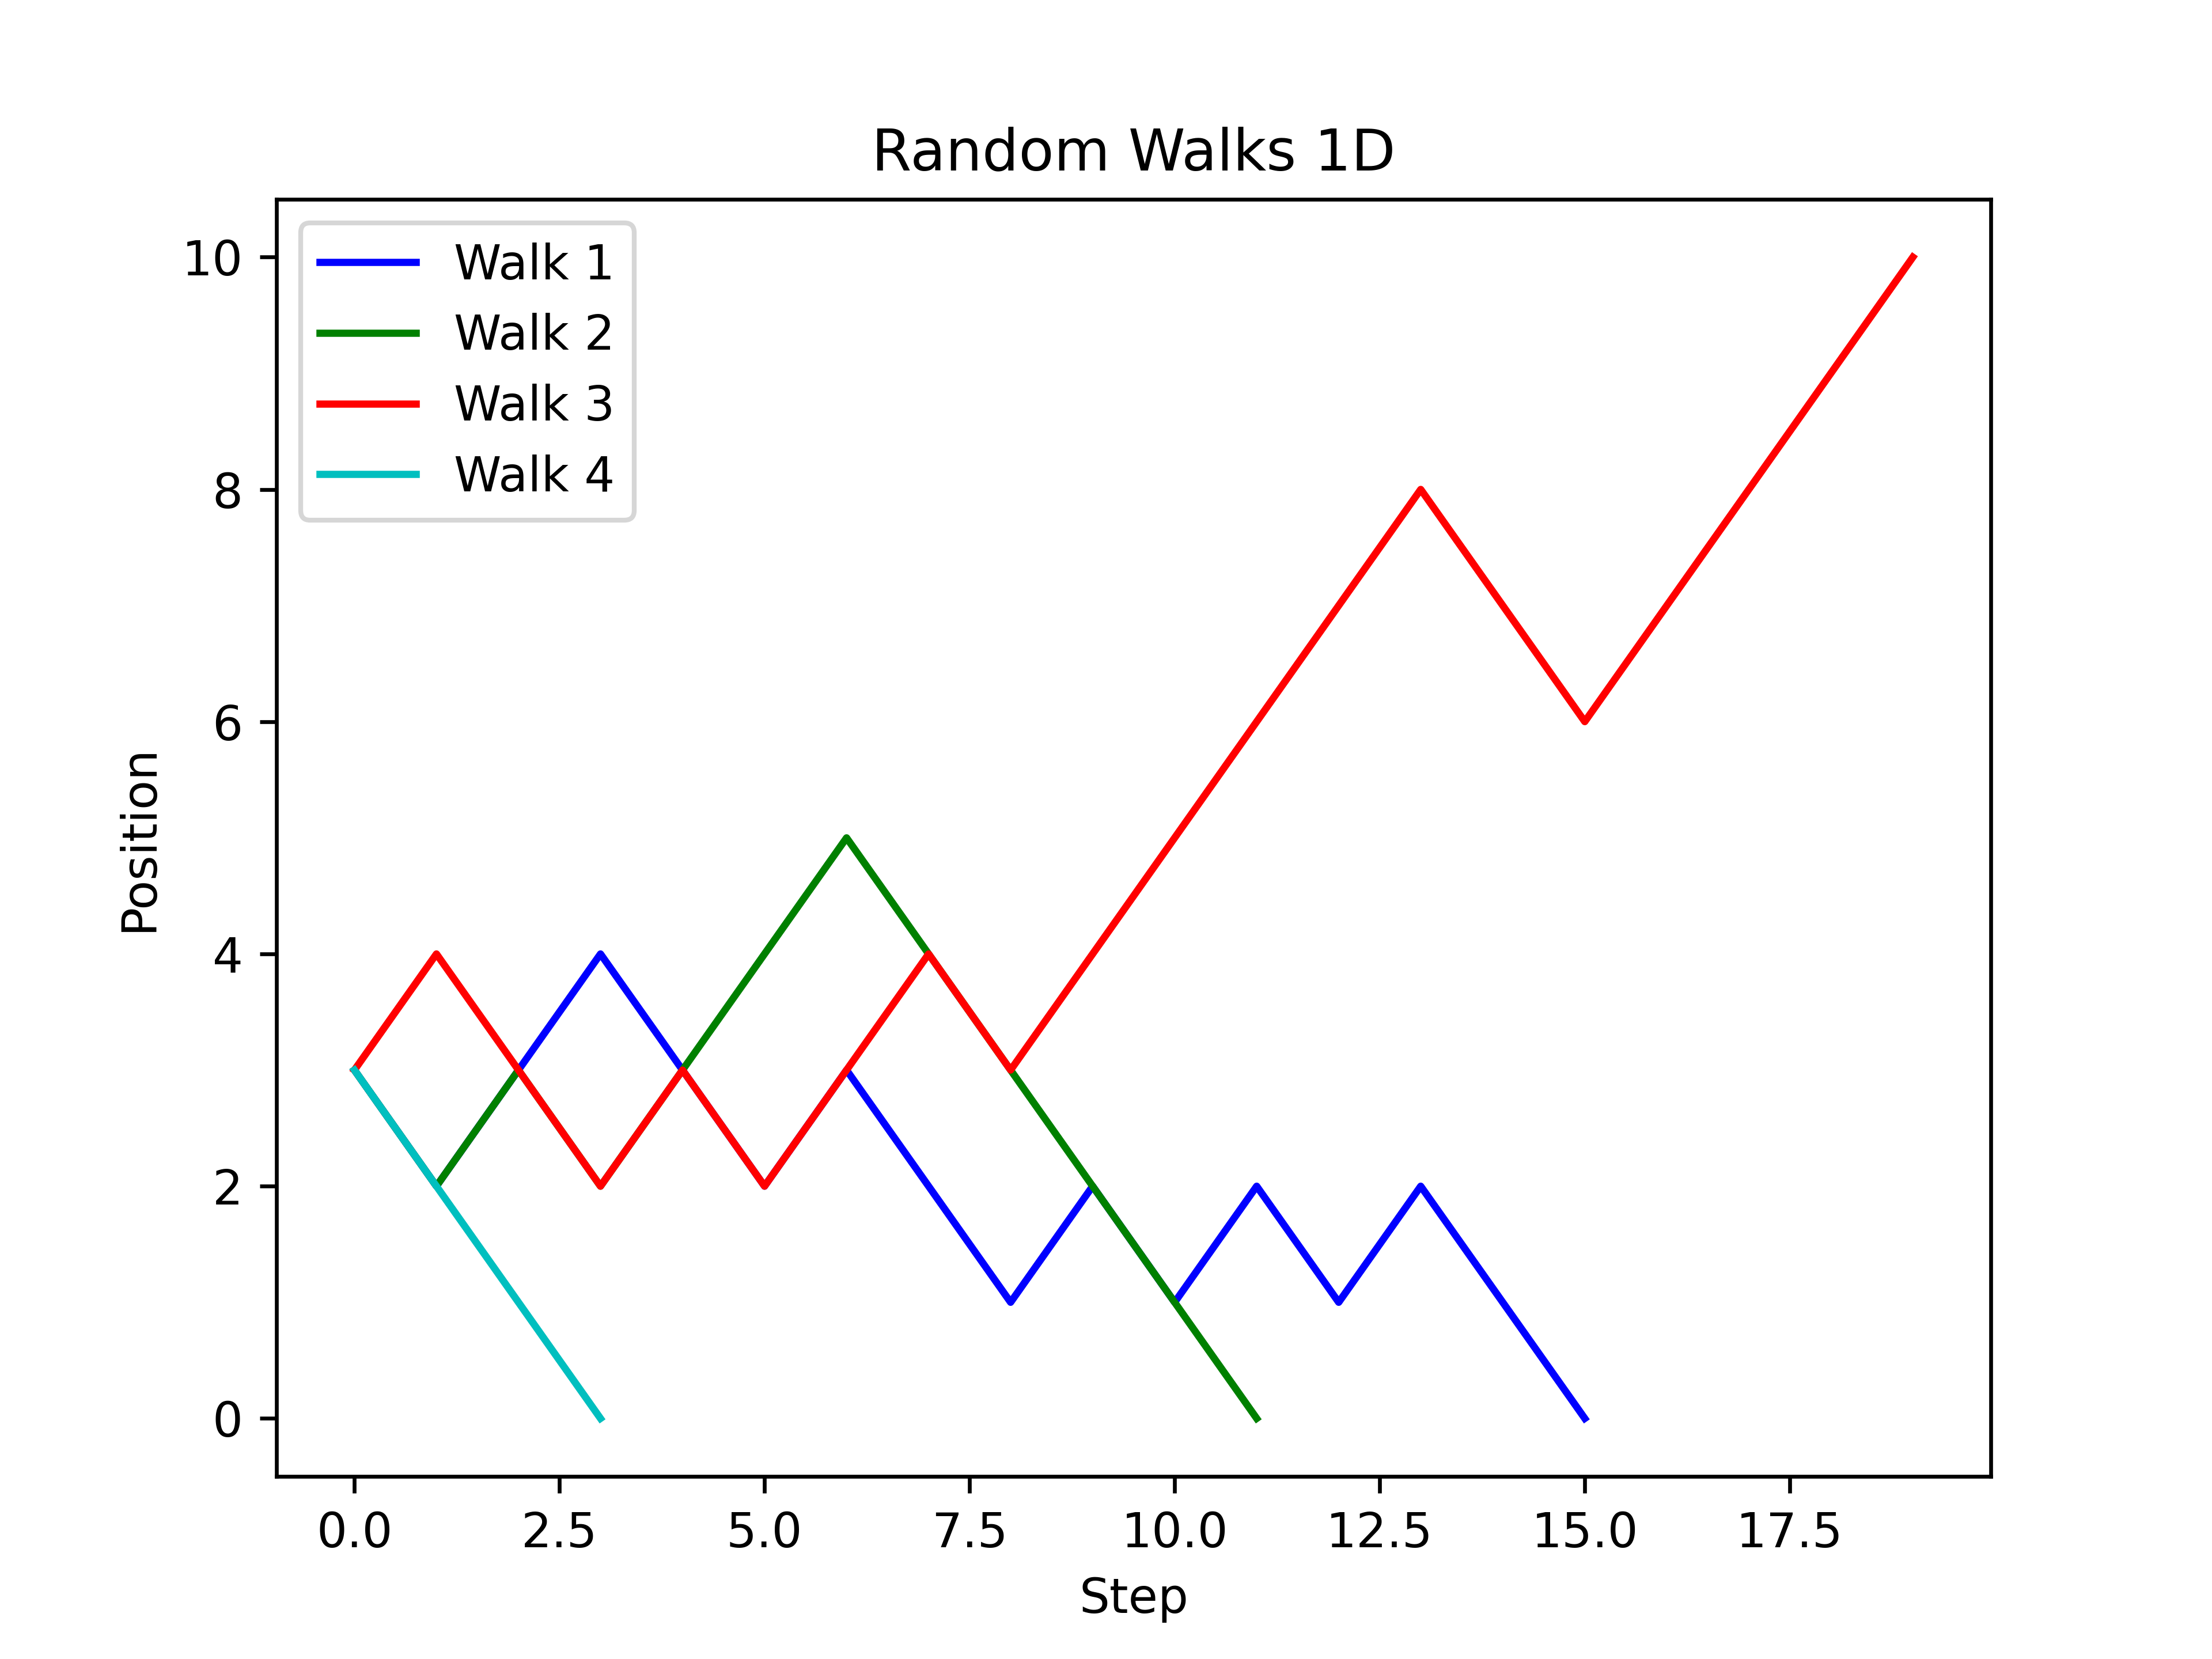
Examples multi 2D walks are below:
1.4. 2D walks analysis
The code below simulates a 2D random walk.
1from pathlib import Path
2import random
3import matplotlib.pyplot as plt
4
5currfile_dir = Path(__file__).parent
6
7
8def random_walk(n):
9 """
10 Simulates a 2D random walk of `n` steps.
11 Returns the final coordinates after the walk.
12 """
13 x, y = 0, 0
14 for _ in range(n):
15 (dx, dy) = random.choice([(0, 1), (0, -1), (1, 0), (-1, 0)])
16 x += dx
17 y += dy
18 return (x, y)
19
20
21def simulate_walks(walk_lengths, number_of_walks, dist_to_home):
22 """
23 Simulates multiple 2D random walks for each walk length in `walk_lengths`.
24 Calculates the percentage of walks that end within `dist_to_home` blocks of the origin for each walk length.
25 Returns a list of percentages for each walk length.
26 """
27 percentages = []
28 for walkn in walk_lengths:
29 close_to_home = 0
30 for _ in range(number_of_walks):
31 walk = random_walk(walkn)
32 if abs(walk[0]) + abs(walk[1]) <= dist_to_home:
33 close_to_home += 1
34 percentages.append(int(100 * close_to_home / number_of_walks))
35 return percentages
36
37
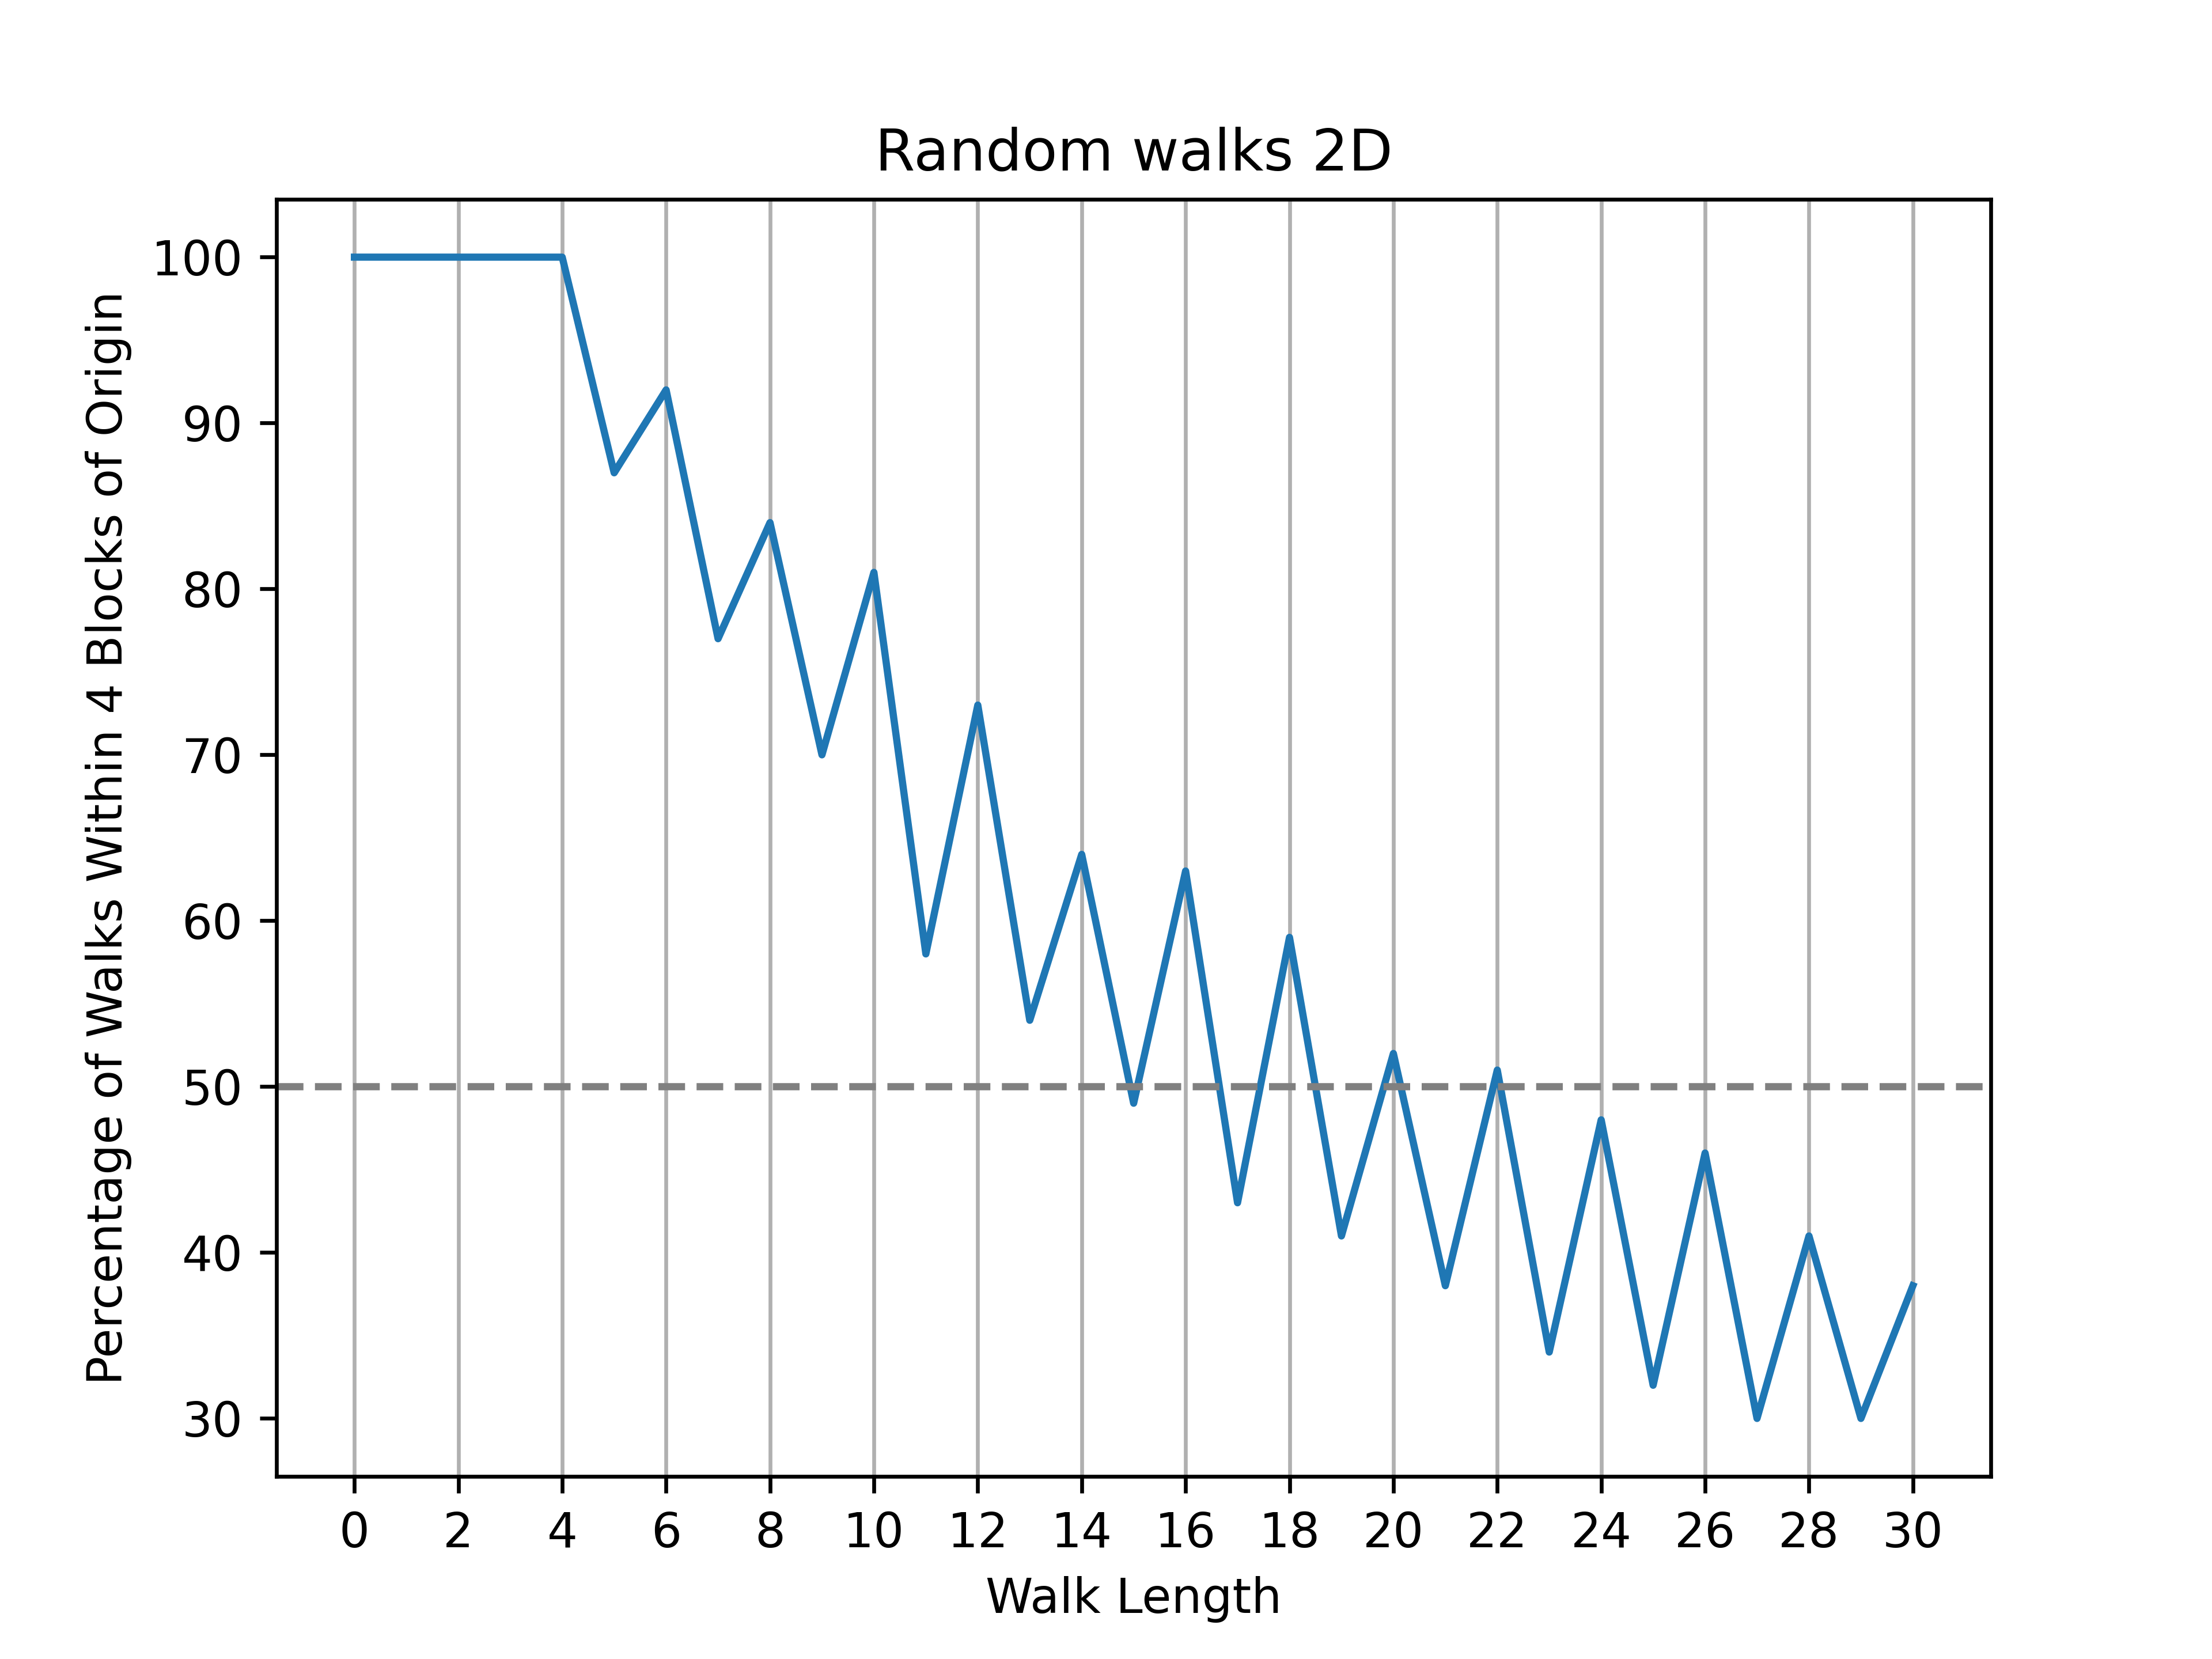
38def plot_results(y, x):
39 """
40 Plots the percentage of walks that end within 4 blocks of the origin for each walk length.
41 `y` is a list of walk lengths and `x` is a list of percentages.
42 """
43 plt.plot(y, x)
44 plt.title("Random walks 2D")
45 plt.xlabel("Walk Length")
46 plt.ylabel("Percentage of Walks Within 4 Blocks of Origin")
47 plt.axhline(y=50, color="gray", linestyle="--")
48 plt.xticks(range(0, max(walk_lengths) + 1, 2))
49 plt.grid(axis="x")
50 save_plot(plt, "random_walks_2D.png")
51 plt.show()
52
53
54def save_plot(plot, filename):
55 """
56 Saves the given plot to a file with the given filename within the curr directory
57 """
58 filepath = currfile_dir / filename
59 plot.savefig(filepath, dpi=600)
60
61
62number_of_walks = 1000
63walk_lengths = range(30)
64dist_to_home = 4
65percentages = simulate_walks(walk_lengths, number_of_walks, dist_to_home)
66plot_results(walk_lengths, percentages)
The random_walk function takes an argument n which represents the number of steps in the walk.
The function initializes the starting position at (0, 0) and then simulates the walk by generating random steps using the random.choice function.
The step is chosen from a list of possible steps: up, down, left, or right.
The new position is calculated by adding the step to the current position.
The script then simulates number_of_walks walks for each walk length from 0 to 30.
For each walk, it checks if the final position is within (dist_to_home) 4 blocks of the origin (using the Manhattan distance) and if it is, increments the close_to_home variable.
Finally, for plotting, it returns the walk length and the percentage of walks that ended within 4 blocks of the origin.
The Manhattan distance, also known as the taxicab distance or city block distance, is a way to measure the distance between two points in a grid-like space.
It is calculated as the sum of the absolute differences between the coordinates of the two points.
For example, if there are two points P1 and P2 with coordinates (x1, y1) and (x2, y2), respectively, then the Manhattan distance between them is abs(x1 - x2) + abs(y1 - y2).
This distance can be imagined as the length needed to move between two points in a grid where you can only move up, down, left or right.
1.5. Levy flights
Levy flights are random walks with longer jumps.
They can simulate animals looking for food.
The code below creates some longer jumps.
The pseudocode to simulate a 2D random walk with Levy flights and plot the results.
FUNCTION levy_flight(total_steps, levy_interval, min_jump, max_jump)
    x ← 0
    y ← 0
    coords ← [(0, 0)]

    FOR i ← 0 TO total_steps - 1 DO
        IF i MOD levy_interval = 0 THEN
            r ← RANDOM INTEGER BETWEEN min_jump AND max_jump
            theta ← RANDOM ANGLE BETWEEN 0 AND 2π
            dx ← INTEGER PART OF (r * COS(theta))
            dy ← INTEGER PART OF (r * SIN(theta))
        ELSE
            (dx, dy) ← RANDOM CHOICE FROM [(0,1), (0,-1), (1,0), (-1,0)]
        ENDIF

        x ← x + dx
        y ← y + dy
        APPEND (x, y) TO coords
    ENDFOR

    RETURN coords
ENDFUNCTION


FUNCTION plot_walk(coords, levy_interval, total_steps)
    x_coords ← EXTRACT X VALUES FROM coords
    y_coords ← EXTRACT Y VALUES FROM coords

    DRAW LINE GRAPH OF (x_coords, y_coords)
    MARK STARTING POINT GREEN
    MARK ENDING POINT RED

    max_coord ← MAXIMUM ABSOLUTE VALUE AMONG ALL COORDINATES

    IF max_coord > 100 THEN
        ticks ← MULTIPLES OF 50 UP TO max_coord
    ELSE IF max_coord > 60 THEN
        ticks ← MULTIPLES OF 20 UP TO max_coord
    ELSE IF max_coord > 30 THEN
        ticks ← MULTIPLES OF 10 UP TO max_coord
    ELSE IF max_coord > 16 THEN
        ticks ← MULTIPLES OF 5 UP TO max_coord
    ELSE IF max_coord > 8 THEN
        ticks ← MULTIPLES OF 2 UP TO max_coord
    ELSE
        ticks ← INTEGERS FROM -max_coord TO +max_coord
    ENDIF

    SET X-AXIS TICKS ← ticks
    SET Y-AXIS TICKS ← ticks
    LIMIT X-AXIS AND Y-AXIS TO [-max_coord, +max_coord]
    ADD LEGEND FOR Start AND End
    SET TITLE ← "Random Walk (" + total_steps + " steps)"
    ADJUST LAYOUT FOR LEGEND
    CALL save_plot(graph, "random_walk_Levy_every_" + levy_interval + "_of_" + total_steps)
    DISPLAY graph
ENDFUNCTION


FUNCTION save_plot(graph, filename)
    filepath ← DIRECTORY OF THIS FILE + filename
    SAVE graph TO filepath WITH HIGH RESOLUTION
ENDFUNCTION


BEGIN
    INPUTS:
        levy_interval ← 100        -- number of steps between Levy jumps
        total_steps ← 1000         -- total number of steps in the walk
        min_jump ← 10              -- minimum jump size for Levy flight
        max_jump ← 20              -- maximum jump size for Levy flight

    PROCESS:
        coords ← CALL levy_flight(total_steps, levy_interval, min_jump, max_jump)
        CALL plot_walk(coords, levy_interval, total_steps)

    OUTPUT:
        DISPLAY graph of the walk with start and end marked
END
The python to simulate a 2D random walk with Levy flights and plot the results.
 1import matplotlib.pyplot as plt
 2import random
 3from pathlib import Path
 4import math
 5
 6currfile_dir = Path(__file__).parent
 7
 8
 9def levy_flight(n, levy, min_jump, max_jump):
10    """
11    Simulate a 2D Lévy flight of `n` steps.
12
13    Parameters:
14    n (int): The total number of steps
15    levy (int): The number of steps before a Lévy jump.
16
17    Returns:
18    list: The list of (x, y) coordinates visitedt.
19    """
20    x, y = 0, 0
21    coords = [(x, y)]
22    for i in range(n):
23        if i % levy == 0:
24            r = random.randrange(min_jump, max_jump)
25            theta = random.uniform(0, 2 * math.pi)
26            dx, dy = int(r * math.cos(theta)), int(r * math.sin(theta))
27        else:
28            (dx, dy) = random.choice([(0, 1), (0, -1), (1, 0), (-1, 0)])
29        x += dx
30        y += dy
31        coords.append((x, y))
32    return coords
33
34
35def plot_walk(coords, levy):
36    """
37    Plot the path of a 2D random walk.
38
39    Parameters:
40    coords (list): The list of (x, y) coordinates visited during the walk.
41    """
42    x_coords = [x for x, y in coords]
43    y_coords = [y for x, y in coords]
44    plt.plot(x_coords, y_coords)
45    plt.scatter(x_coords[0], y_coords[0], color="green", label="Start")
46    plt.scatter(x_coords[-1], y_coords[-1], color="red", label="End")
47    max_coord = max(max(map(abs, x_coords)), max(map(abs, y_coords)))
48    if max_coord > 100:
49        max_coord = max_coord + (-max_coord % 50)
50        ticks = range(-max_coord, max_coord + 1, 50)
51    elif max_coord > 60:
52        max_coord = max_coord + (-max_coord % 20)
53        ticks = range(-max_coord, max_coord + 1, 20)
54    elif max_coord > 30:
55        max_coord = max_coord + (-max_coord % 10)
56        ticks = range(-max_coord, max_coord + 1, 10)
57    elif max_coord > 16:
58        max_coord = max_coord + (-max_coord % 5)
59        ticks = range(-max_coord, max_coord + 1, 5)
60    elif max_coord > 8:
61        max_coord = max_coord + (-max_coord % 2)
62        ticks = range(-max_coord, max_coord + 1, 2)
63    else:
64        ticks = range(-int(max_coord), int(max_coord) + 1)
65    plt.xticks(ticks)
66    plt.yticks(ticks)
67    plt.xlim(-max_coord, max_coord)
68    plt.ylim(-max_coord, max_coord)
69    plt.legend(loc="center left", bbox_to_anchor=(1.05, 0.5))
70    plt.title(f"Random Walk ({len(coords)-1} steps)")
71    plt.subplots_adjust(right=0.7)
72    save_plot(plt, f"random_walk_Levy_every_{levy}_of_{len(coords)-1}")
73    plt.show()
74
75
76def save_plot(plot, filename):
77    """
78    Saves the given plot to a file with the given filename within the curr directory
79    """
80    filepath = currfile_dir / filename
81    plot.savefig(filepath, dpi=600)
82
83
84# Example usage:
85levy = 100
86steps = 1000
87min_jump = 10
88max_jump = 20
89coords = levy_flight(steps, levy, min_jump, max_jump)
90plot_walk(coords, levy)