6. Matplotlib histogram
Matplotlib can be used to draw a histogram.
6.1. Python code
The python code is below.
The code is commented to indicate what each part is doing.
1import matplotlib.pyplot as plt
2import numpy as np
3from statistics import median
4from pathlib import Path
5
6
7def plot_histogram(x, title, median):
8 # Create a new figure with the specified size
9 plt.figure(figsize=(10, 6))
10 # Create a histogram plot of the data in x with the specified bin edges, line width, edge color, and fill color
11 counts, _, _ = plt.hist(x, bins=np.arange(min(x), max(x)+2), linewidth=0.5, edgecolor="blue", color="lightblue")
12 # set the x and y tick locations and labels for the plot to display integer values along both axes, with an offset of 0.5 units for the x tick locations so hte tick is in the middle of each column
13 ticks_offset = 0.5
14 plt.xticks(np.arange(min(x), max(x)+1) + ticks_offset, np.arange(min(x), max(x)+1))
15 plt.yticks(range(0, int(max(counts))+1))
16 # Set the x and y axis title labels
17 plt.xlabel(title)
18 plt.ylabel('Counts')
19 # Set the plot title
20 plt.title(title)
21 # Add a vertical line at the median value with the specified color and line style
22 plt.axvline(median + ticks_offset, color="b", linestyle="--")
23 # Add a text annotation at the specified x and y coordinates with the specified text, rotation, color, and font size
24 plt.text(median + ticks_offset + 0.1, 2, f"Median = {median:.1f}", rotation=90, color="b", fontsize=16)
25 # Adjust the margins of the plot to leave space for the axis labels and title
26 plt.subplots_adjust(bottom=0.07, left=0.07, top=0.95)
27 # Get the directory of the current file
28 currfile_dir = Path(__file__).parent
29 # Replace spaces in title with underscores to create filename for saving figure
30 filename = title.replace(" ", "_")
31 # build the image file path
32 filepath = currfile_dir / (f"{filename}.png")
33 # Save figure (dpi 300 is good when saving so graph has high resolution)
34 plt.savefig(filepath, dpi=600)
35 # Show the plot on the screen
36 plt.show()
37
38
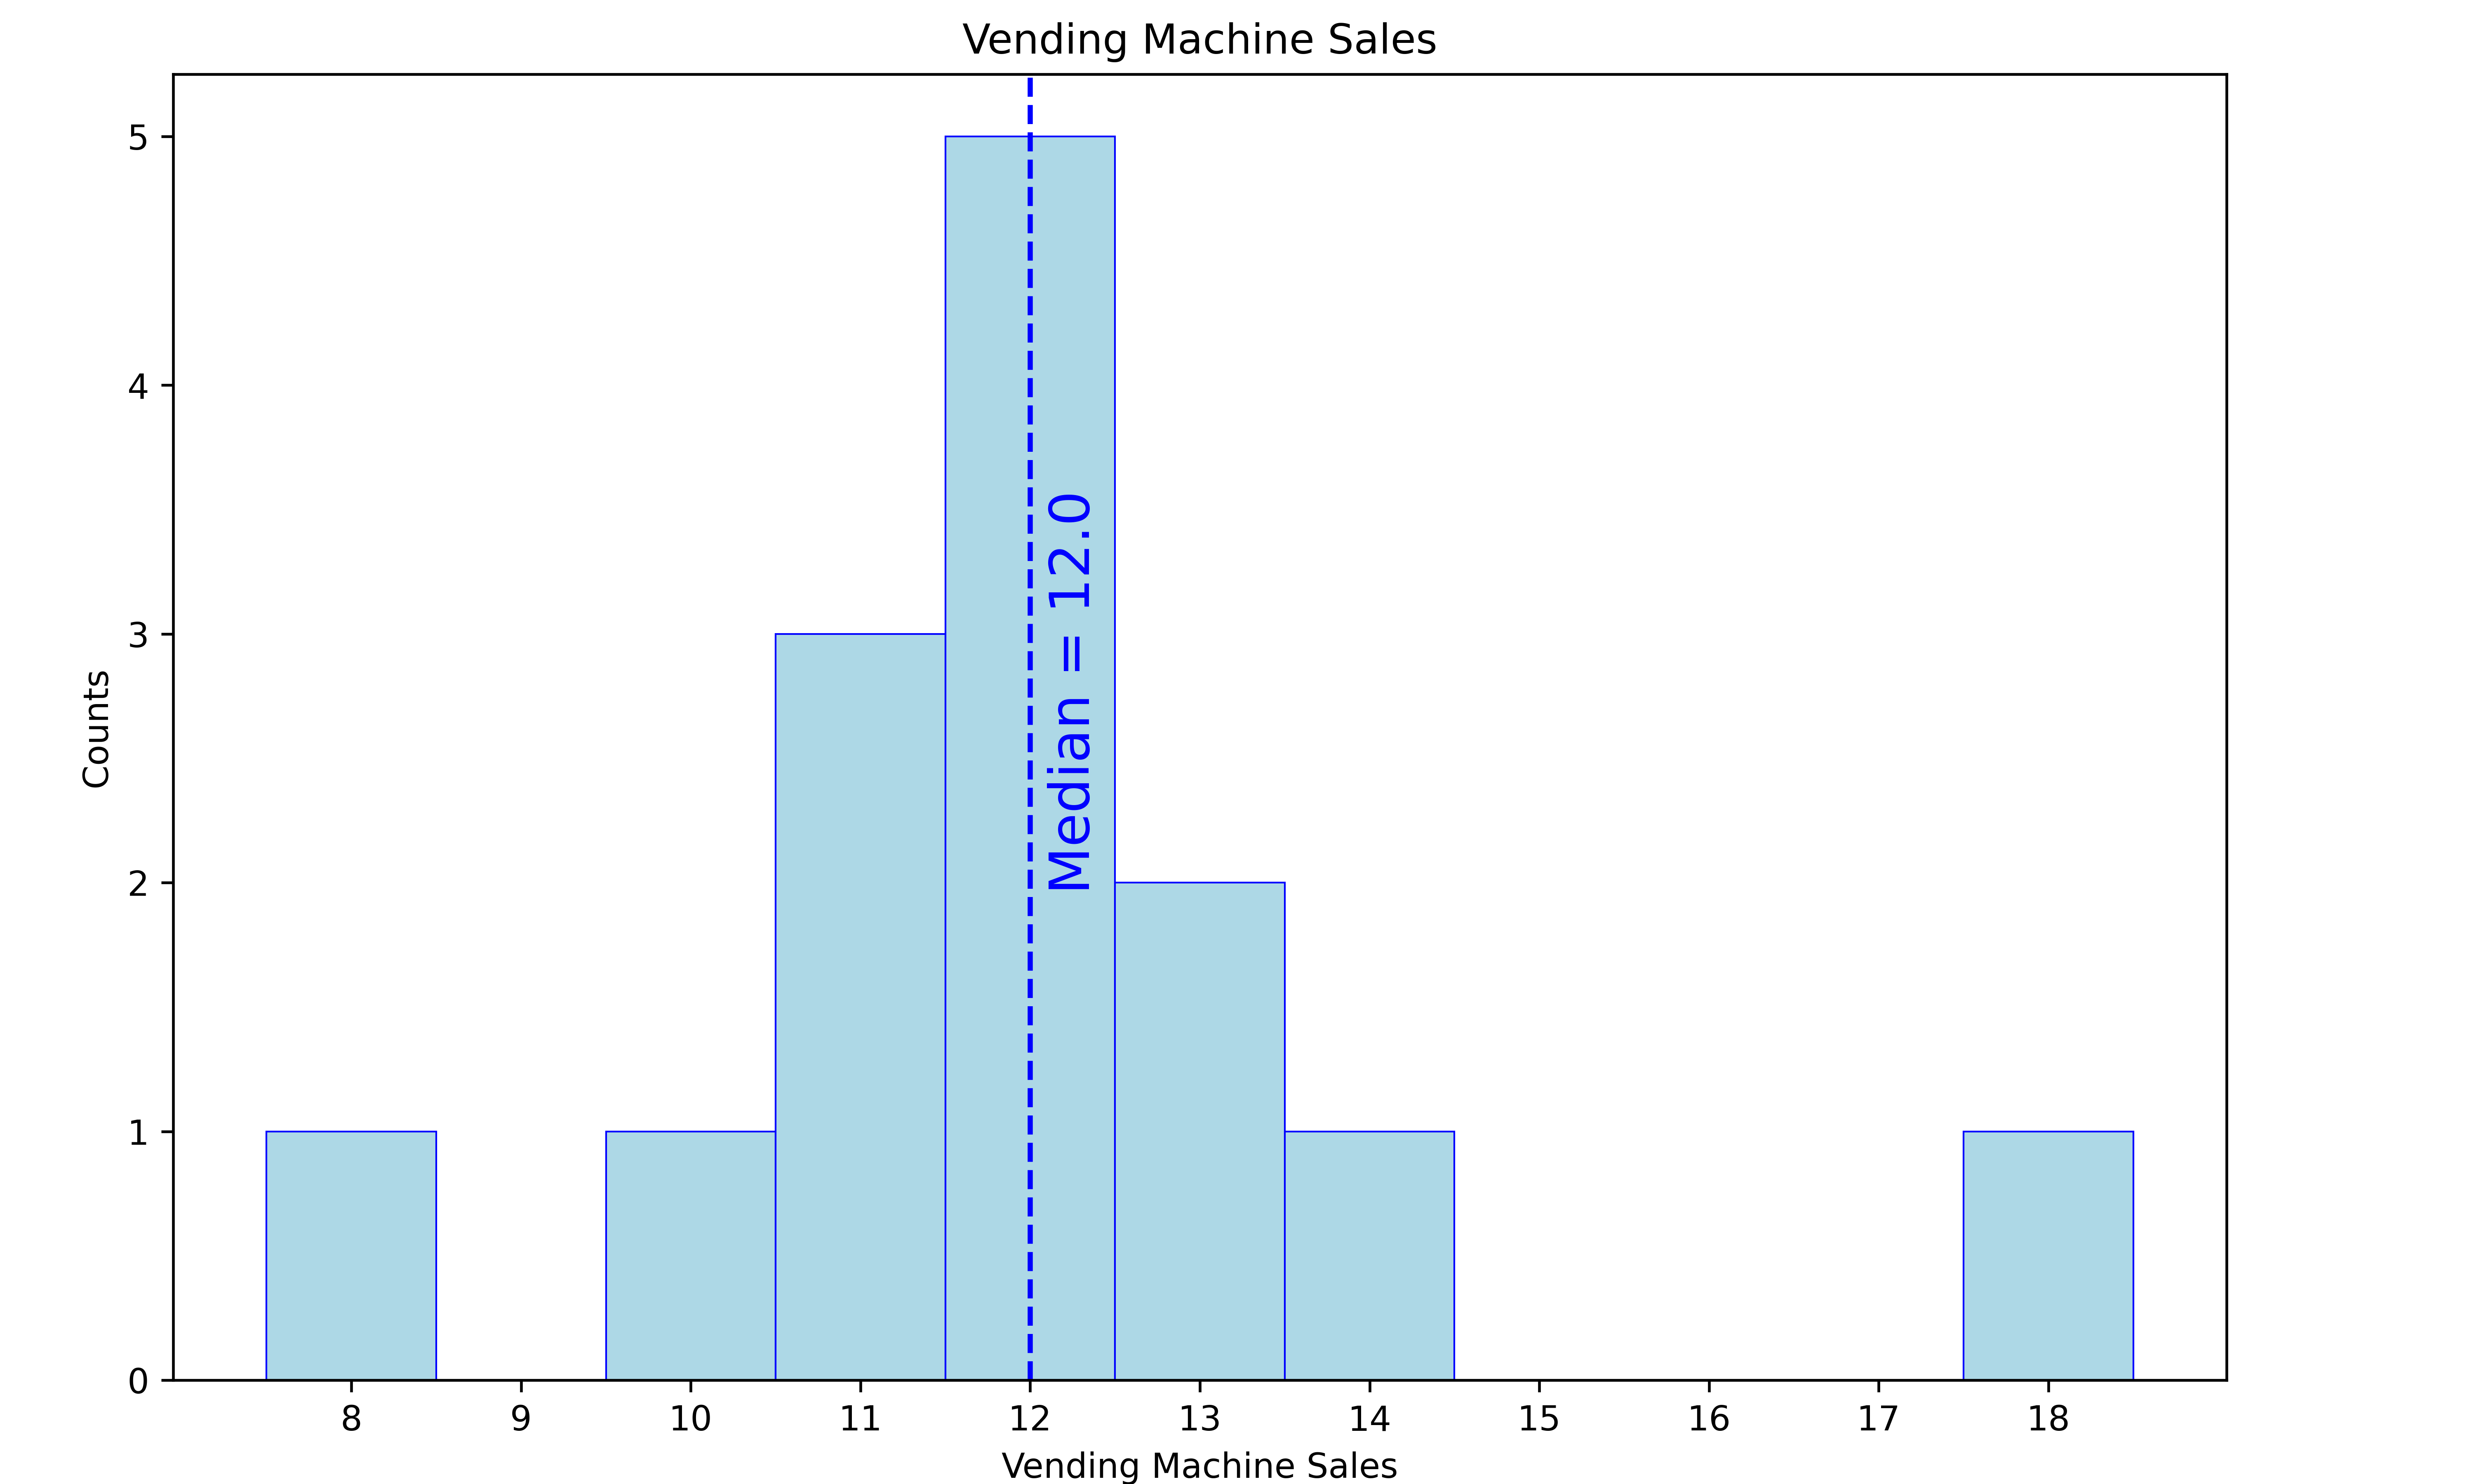
39def plot_vending_sales():
40 # Create a list of data values
41 x = [10, 8, 12, 11, 12, 18, 13, 11, 12, 11, 12, 12, 13, 14]
42 # Compute the median of the data values
43 mymedian = median(x)
44 # Set the title of the plot
45 title = 'Vending Machine Sales'
46 # Call the function to plot the data with the specified title and median value
47 plot_histogram(x, title, mymedian)
48
49
50if __name__ == '__main__':
51 plot_vending_sales()