2. Derangements
VC2M10AA02: level 10A: Devise and use algorithms and simulations to solve mathematical problems
Developing simulations for counter-intuitive problems in probability such as the Monty Hall problem or derangements
2.1. Derangements theory
A derangement is a permutation of a set of elements that leaves no element in its original position. For example, if the original set is {1, 2, 3}, then a derangement could be {2, 3, 1} or {3, 1, 2}, but not {1, 3, 2} nor {2, 1, 3}.
The number of derangements of n elements is denoted by !n and can be calculated by the formula:
!n = n! * (1 - 1/1! + 1/2! - 1/3! + … + (-1)^n / n!)
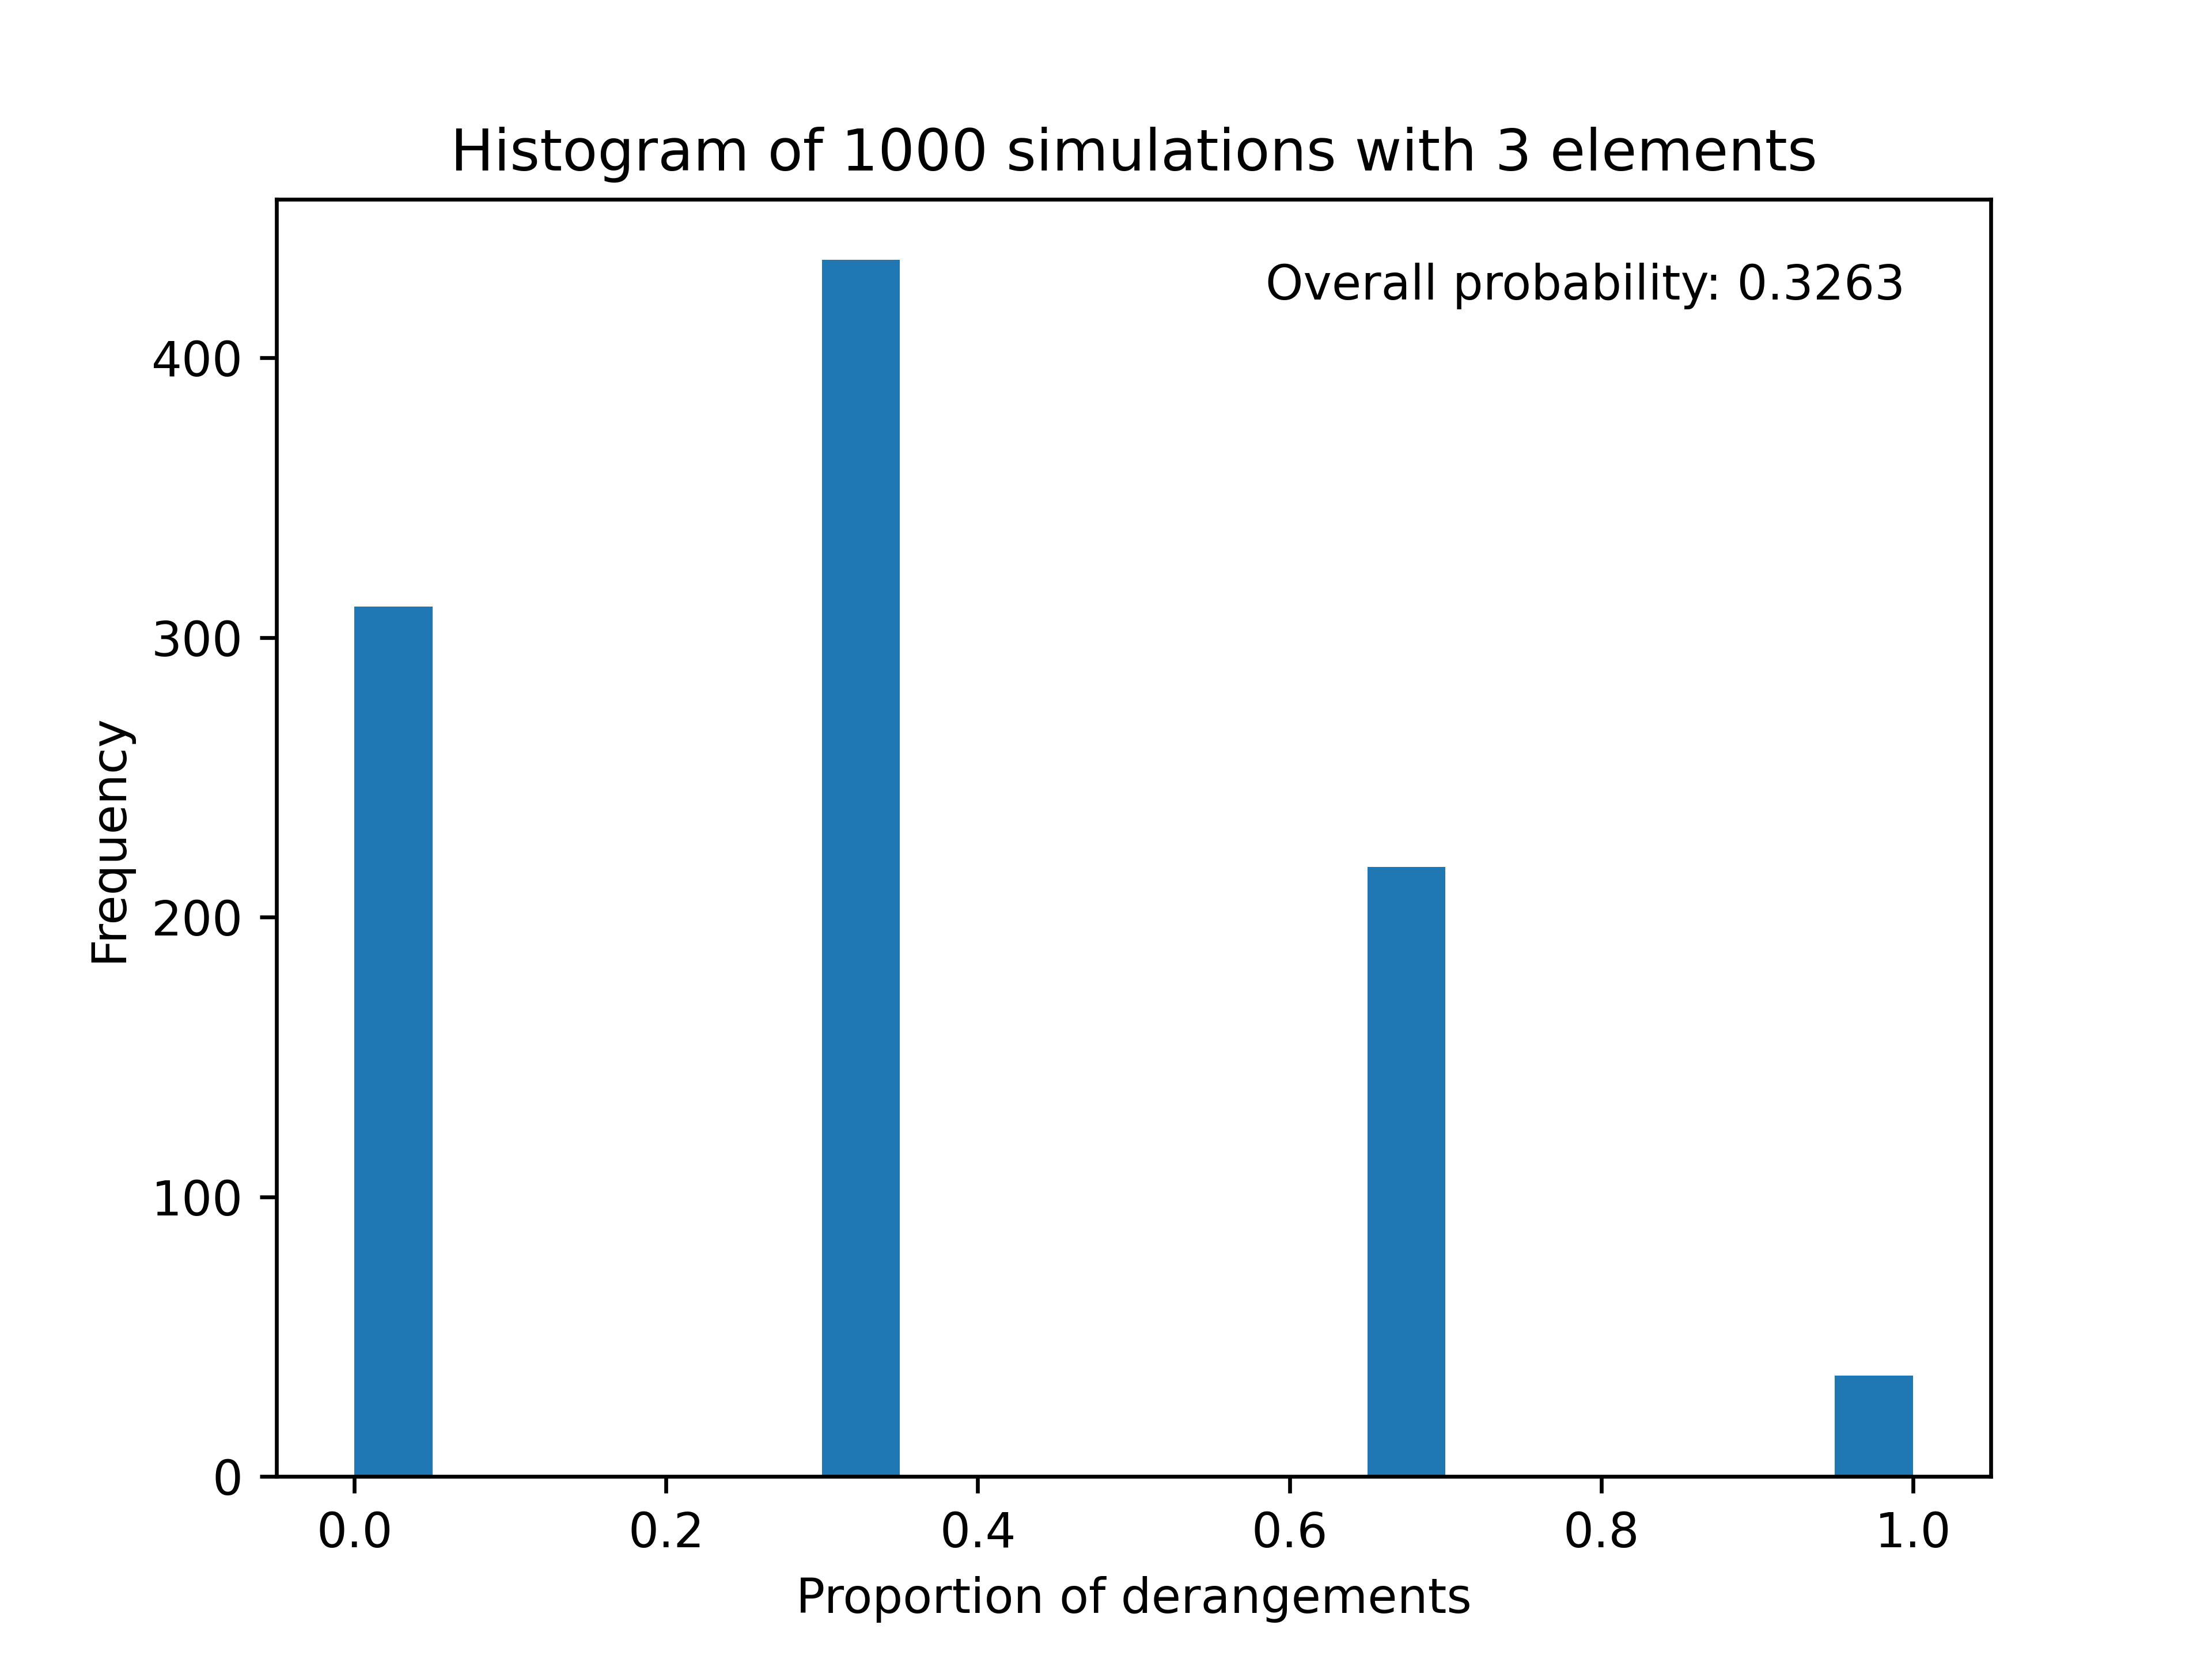
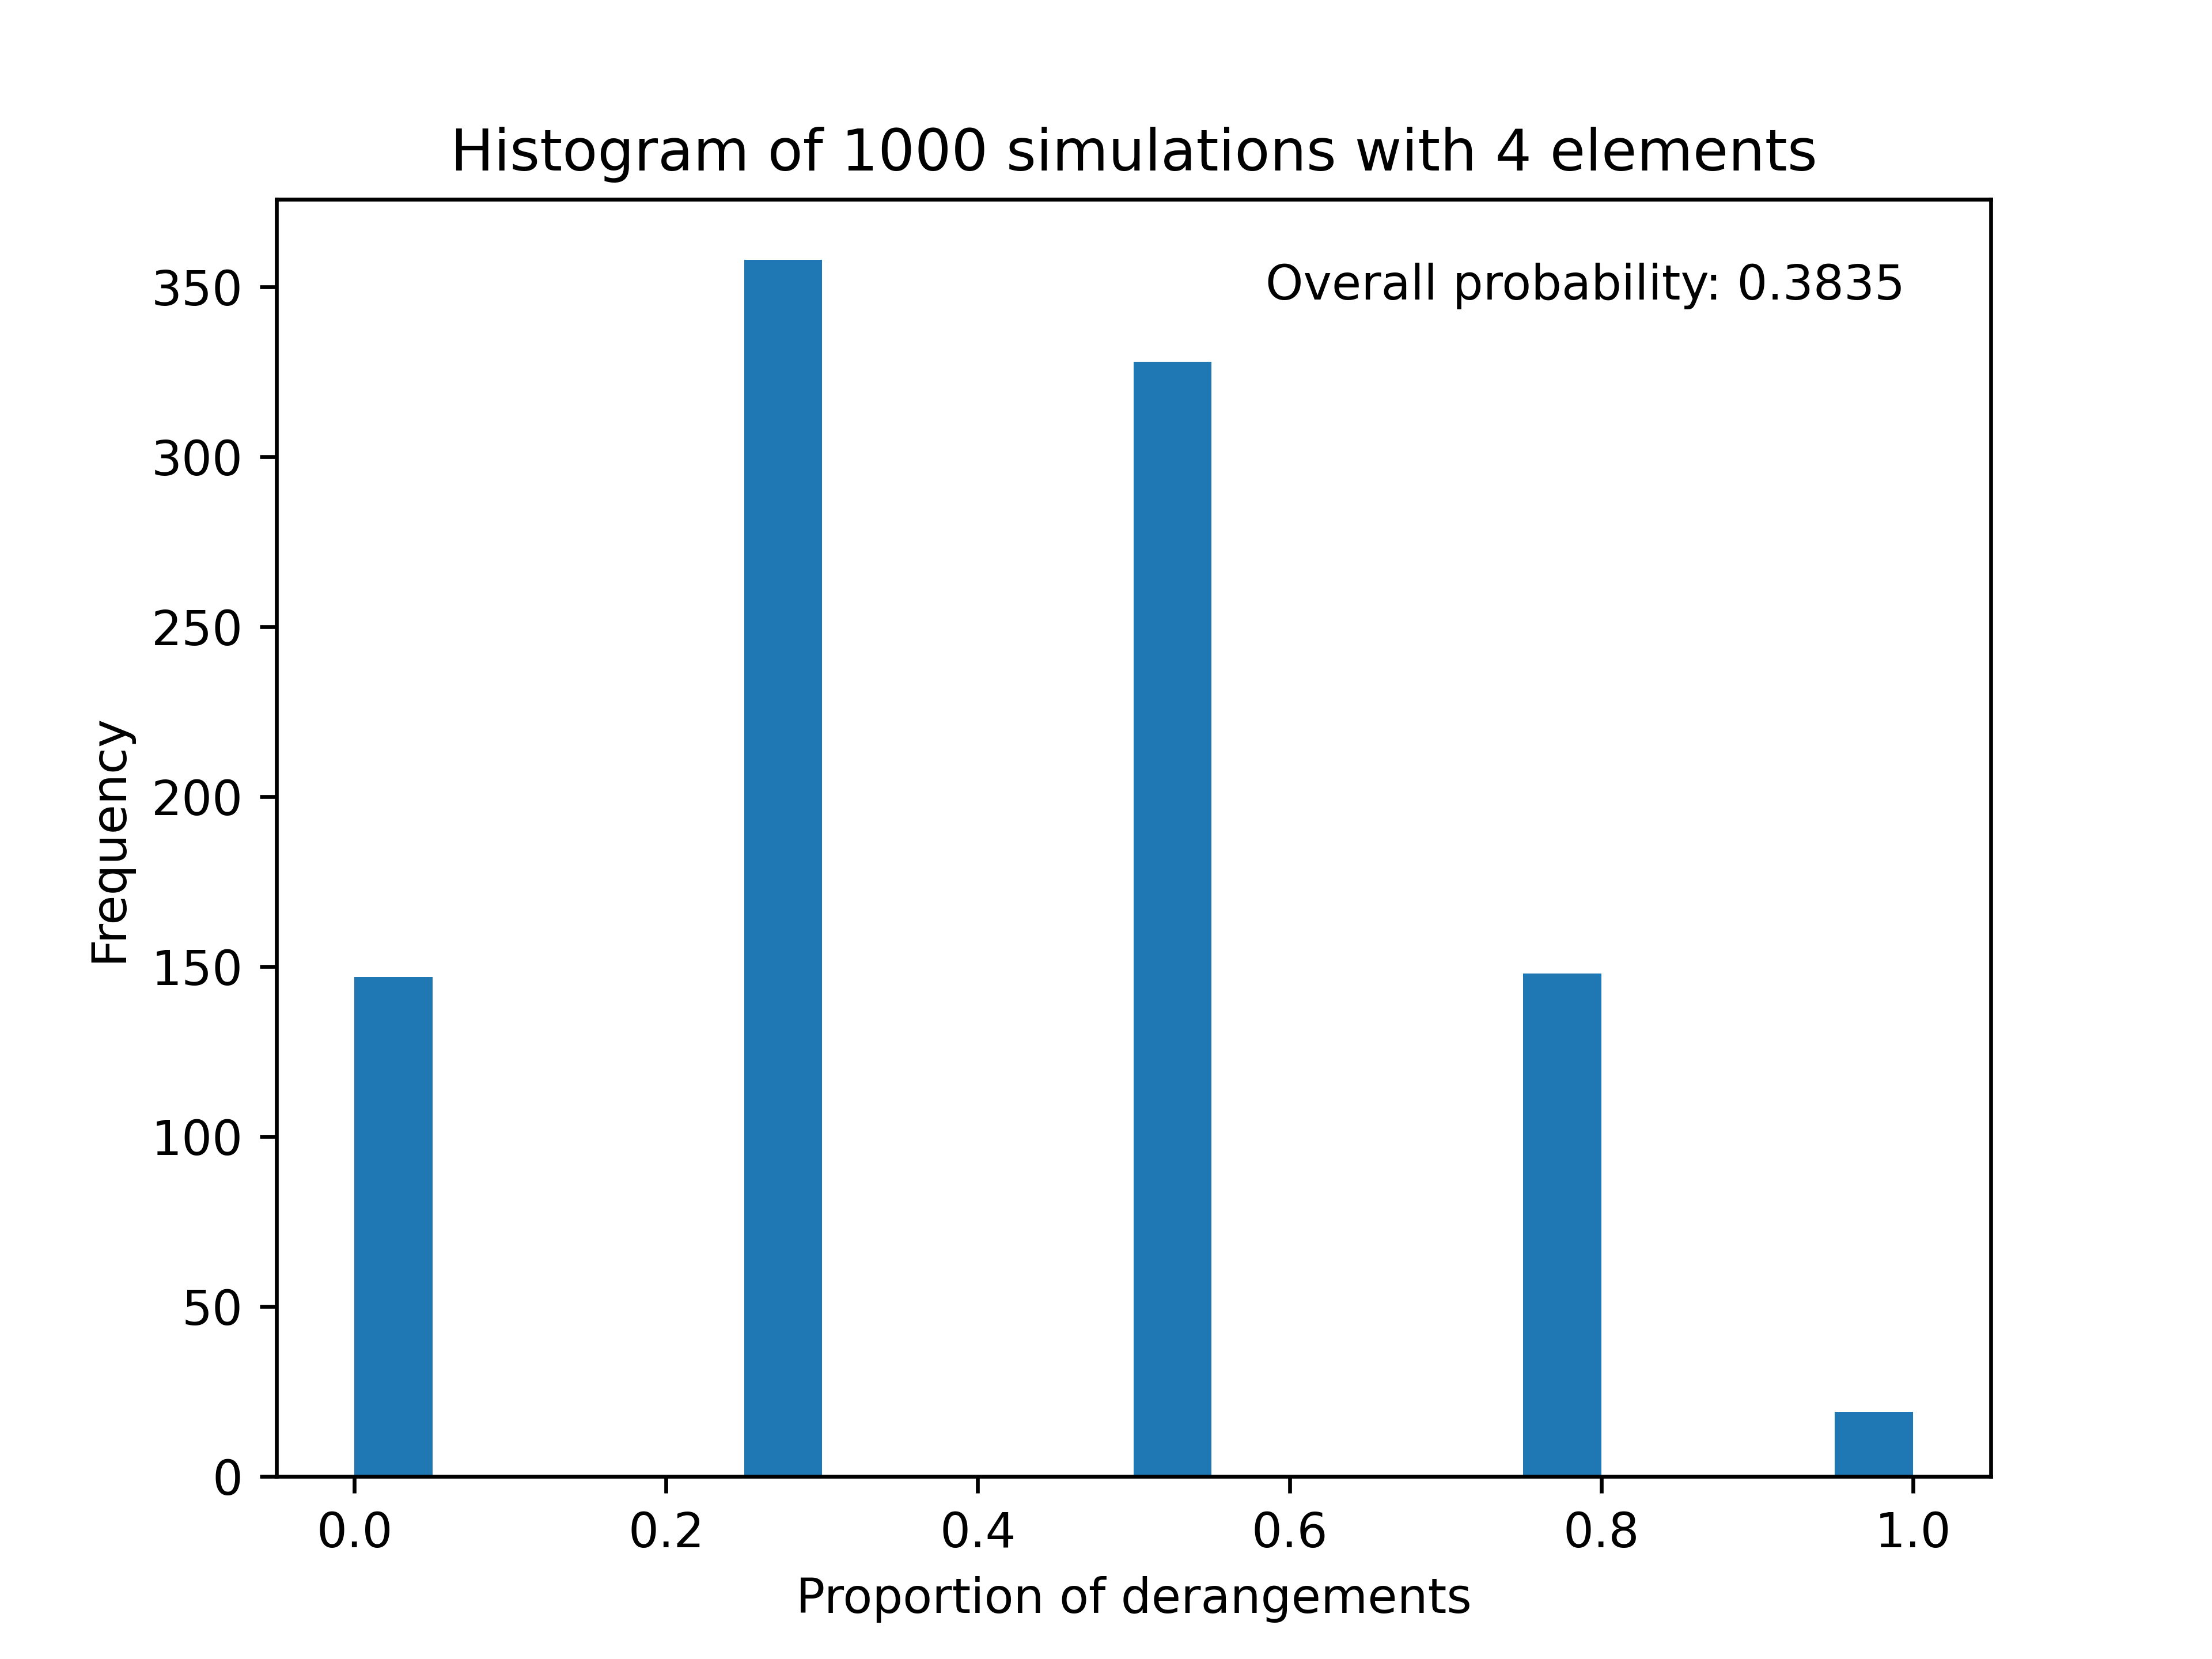
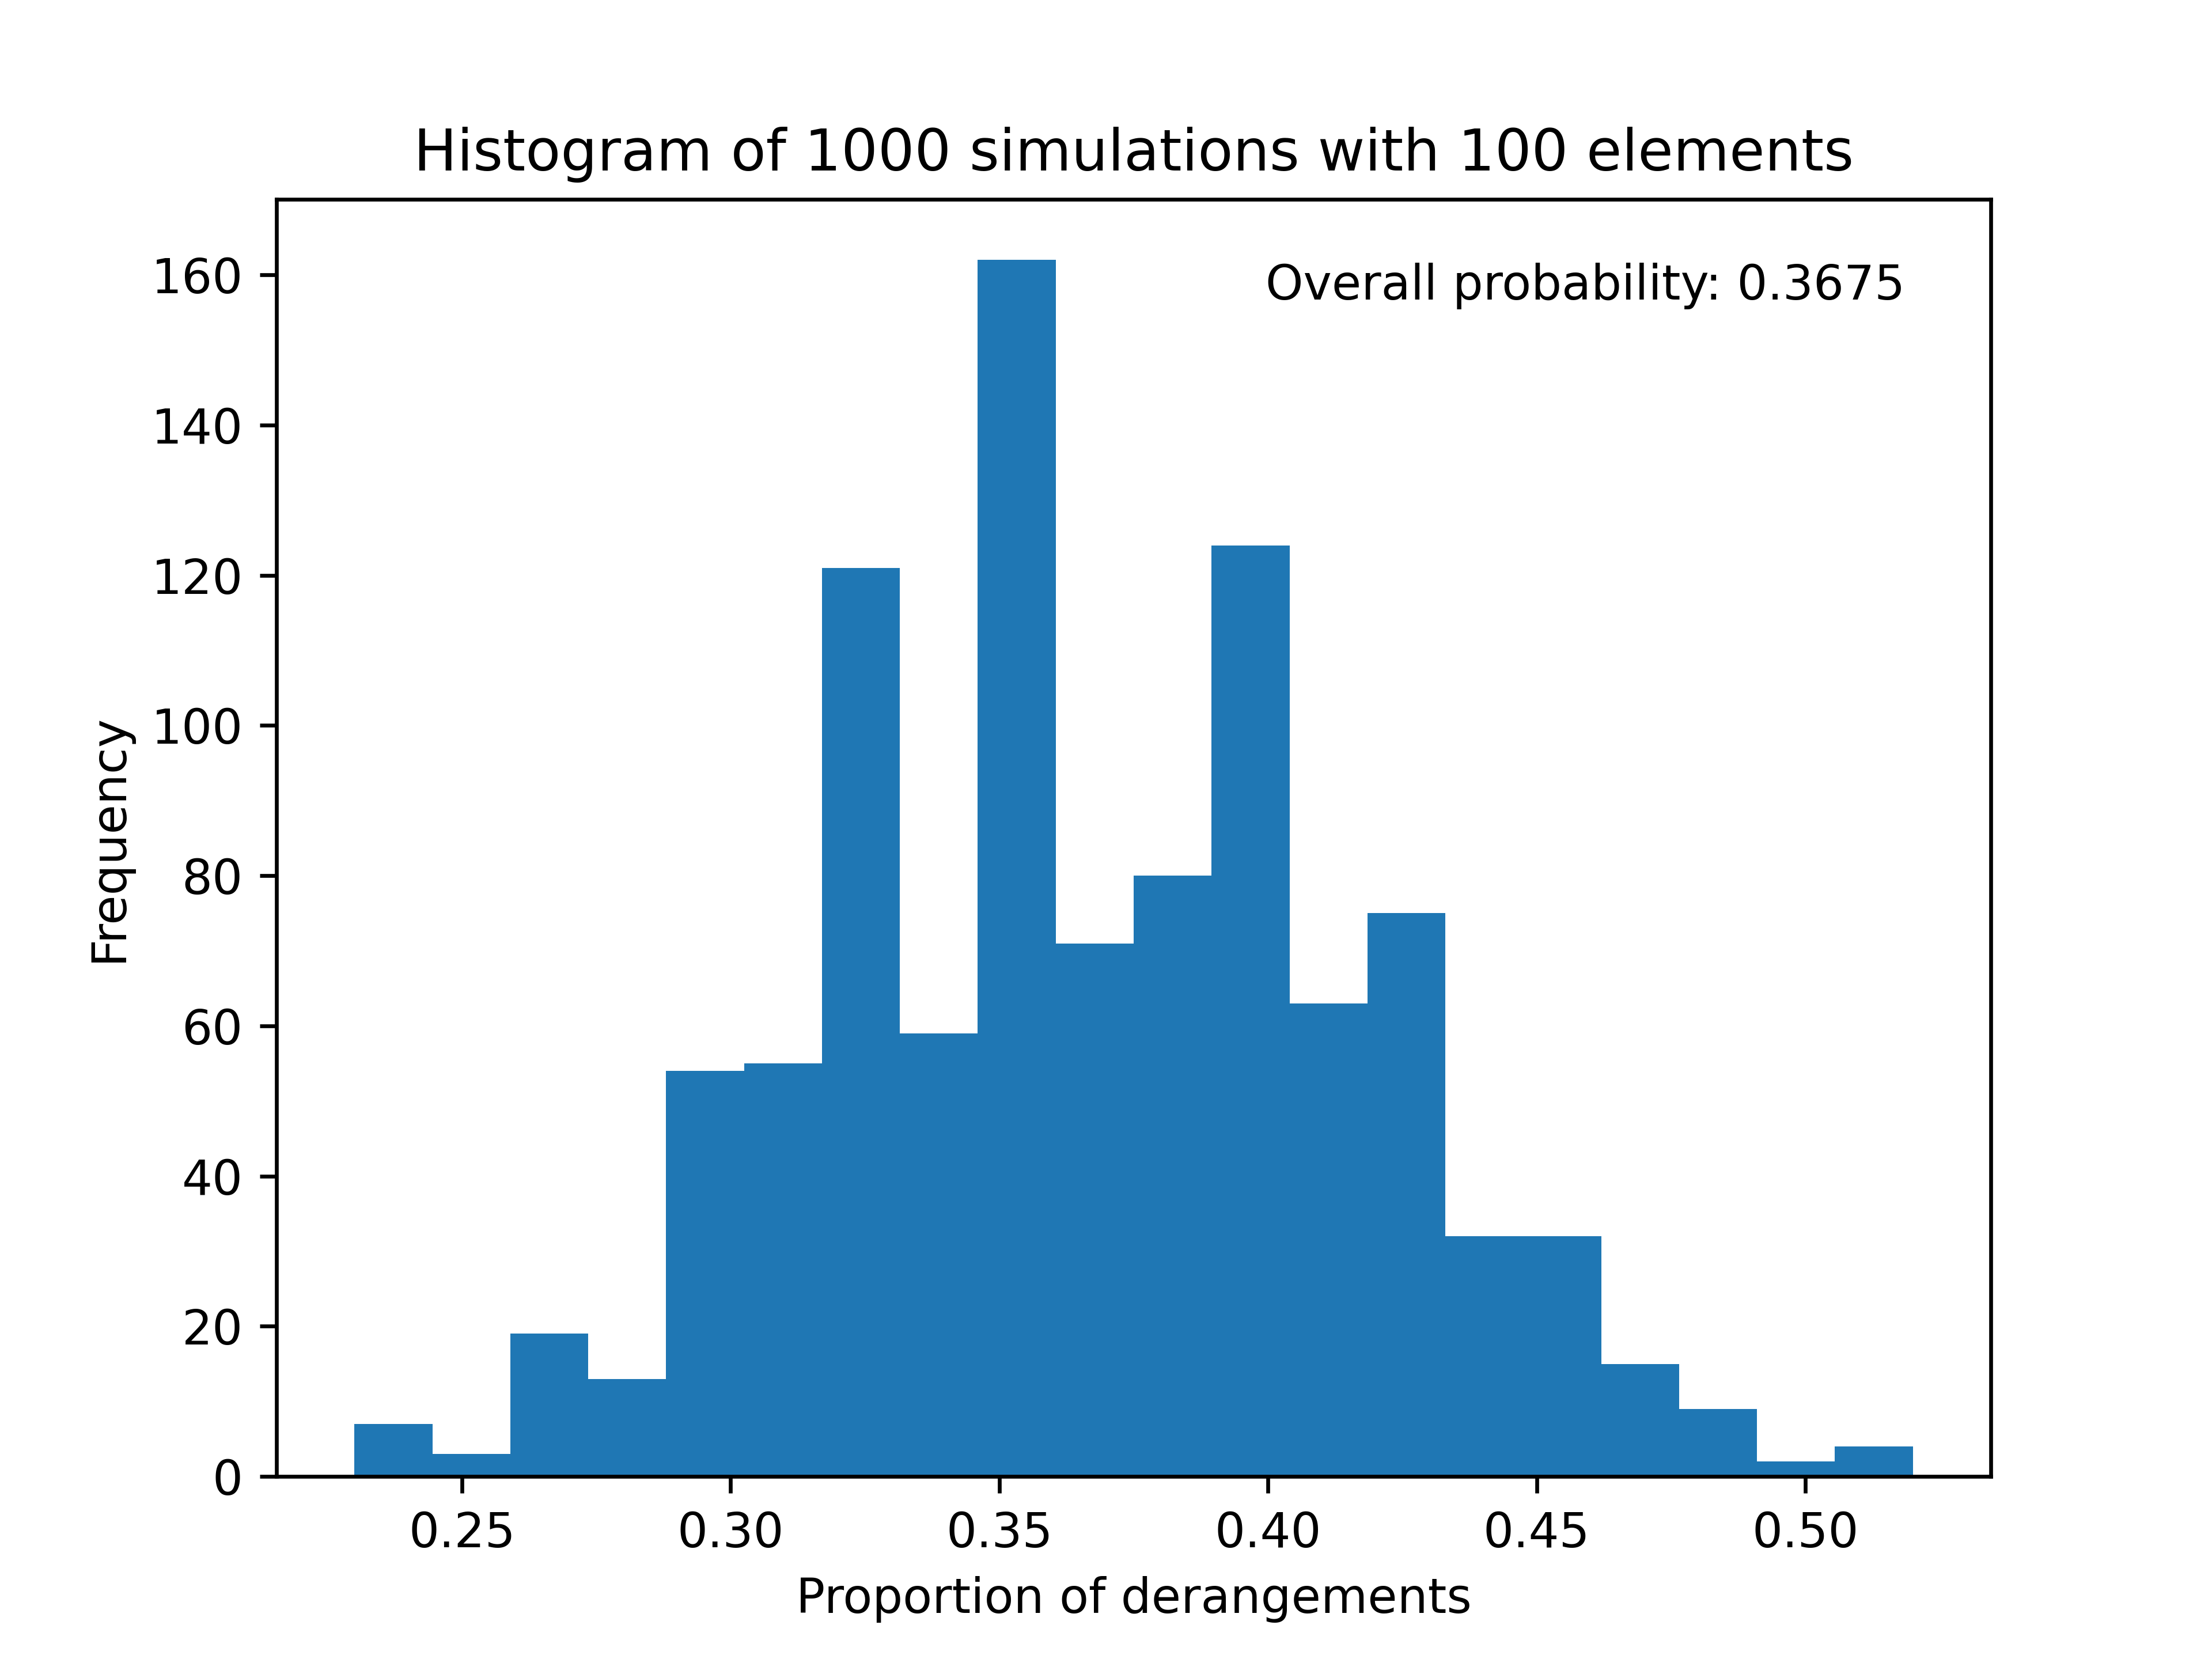
The probability of a random permutation of n elements being a derangement is given by the limit of !n / n! as n approaches infinity, which is approximately 0.3679. This is also known as the derangement constant. It is equal to 1/e.
2.2. Derangement simulation
The result of multiples trials of derangement with 3, 4 and 100 elements is below:
Python code for the simulation:
  1import random
  2import matplotlib.pyplot as plt
  3from pathlib import Path
  4
  5currfile_dir = Path(__file__).parent
  6
  7
  8def is_derangement(permutation):
  9    """
 10    Checks if a permutation is a derangement, which means that no element appears in its original position.
 11
 12    Args:
 13        permutation (list): A list of integers representing a permutation of n elements from 0 to n-1.
 14
 15    Returns:
 16        bool: True if the permutation is a derangement, False otherwise.
 17    """
 18    # Loop over the permutation
 19    for i in range(len(permutation)):
 20        # If any element is in its original position, return False
 21        if permutation[i] == i:
 22            return False
 23    # If no element is in its original position, return True
 24    return True
 25
 26
 27def random_permutation(n):
 28    """
 29    Generates a random permutation of n elements from 0 to n-1.
 30
 31    Args:
 32        n (int): The number of elements in the permutation.
 33
 34    Returns:
 35        list: A list of integers representing a random permutation of n elements from 0 to n-1.
 36    """
 37    # Create a list of n elements from 0 to n-1
 38    elements = list(range(n))
 39    # Shuffle the list randomly
 40    random.shuffle(elements)
 41    # Return the shuffled list
 42    return elements
 43
 44
 45def derangement_simulation(n):
 46    """
 47    Simulates n rounds of generating a random permutation of n elements and checking if it is a derangement.
 48    Returns the proportion of derangements out of n permutations.
 49
 50    Args:
 51        n (int): The number of elements in the permutation and the number of rounds to simulate.
 52
 53    Returns:
 54        float: The proportion of derangements out of n permutations.
 55    """
 56    # Initialize a variable to count the number of derangements
 57    derangements = 0
 58    # Loop over n rounds
 59    for i in range(n):
 60        # Generate a random permutation of n elements
 61        permutation = random_permutation(n)
 62        # Check if the permutation is a derangement and update the count
 63        if is_derangement(permutation):
 64            derangements += 1
 65
 66    # Calculate and return the proportion of derangements
 67    proportion = derangements / n
 68    return proportion
 69
 70
 71def repeat_simulation(m, n, filename):
 72    """
 73    Repeats the simulation m times with n elements and plots the histogram of the proportions of derangements.
 74
 75    Args:
 76        m (int): The number of times to repeat the simulation.
 77        n (int): The number of elements in the permutation.
 78        filename (str): The filename to save the plot as.
 79    """
 80    # Initialize a list to store the proportions of derangements
 81    proportions = []
 82    # Initialize a variable to store the sum of the proportions
 83    total = 0
 84    # Loop over m times
 85    for i in range(m):
 86        # Call the simulation function with n elements and append the result to the list
 87        proportion = derangement_simulation(n)
 88        proportions.append(proportion)
 89        # Add the proportion to the total
 90        total += proportion
 91
 92    # Plot the histogram of the proportions with bins and labels
 93    plt.hist(proportions, bins=20)
 94    plt.xlabel("Proportion of derangements")
 95    plt.ylabel("Frequency")
 96    plt.title(f"Histogram of {m} simulations with {n} elements")
 97
 98    # Calculate and print the overall probability by dividing the total by m
 99    probability = total / m
100
101    # Put the overall probability in a text box on the top right of the plot
102    plt.text(
103        0.95,
104        0.95,
105        f"Overall probability: {probability:.4f}",
106        horizontalalignment="right",
107        verticalalignment="top",
108        transform=plt.gca().transAxes,
109    )
110
111    # Show the plot
112    save_plot(plt, filename)
113    plt.show()
114
115
116def save_plot(plot, filename):
117    """
118    Saves the given plot to a file with the given filename within the curr directory.
119
120    Args:
121        plot (matplotlib.pyplot): The plot to save.
122        filename (str): The filename to save the plot as.
123    """
124    filepath = currfile_dir / filename
125    plot.savefig(filepath, dpi=600)
126
127
128repeat_simulation(1000, 100, "derangement_100.png")