2. Matplotlib bar chart
Matplotlib can be used to draw a bar chart.
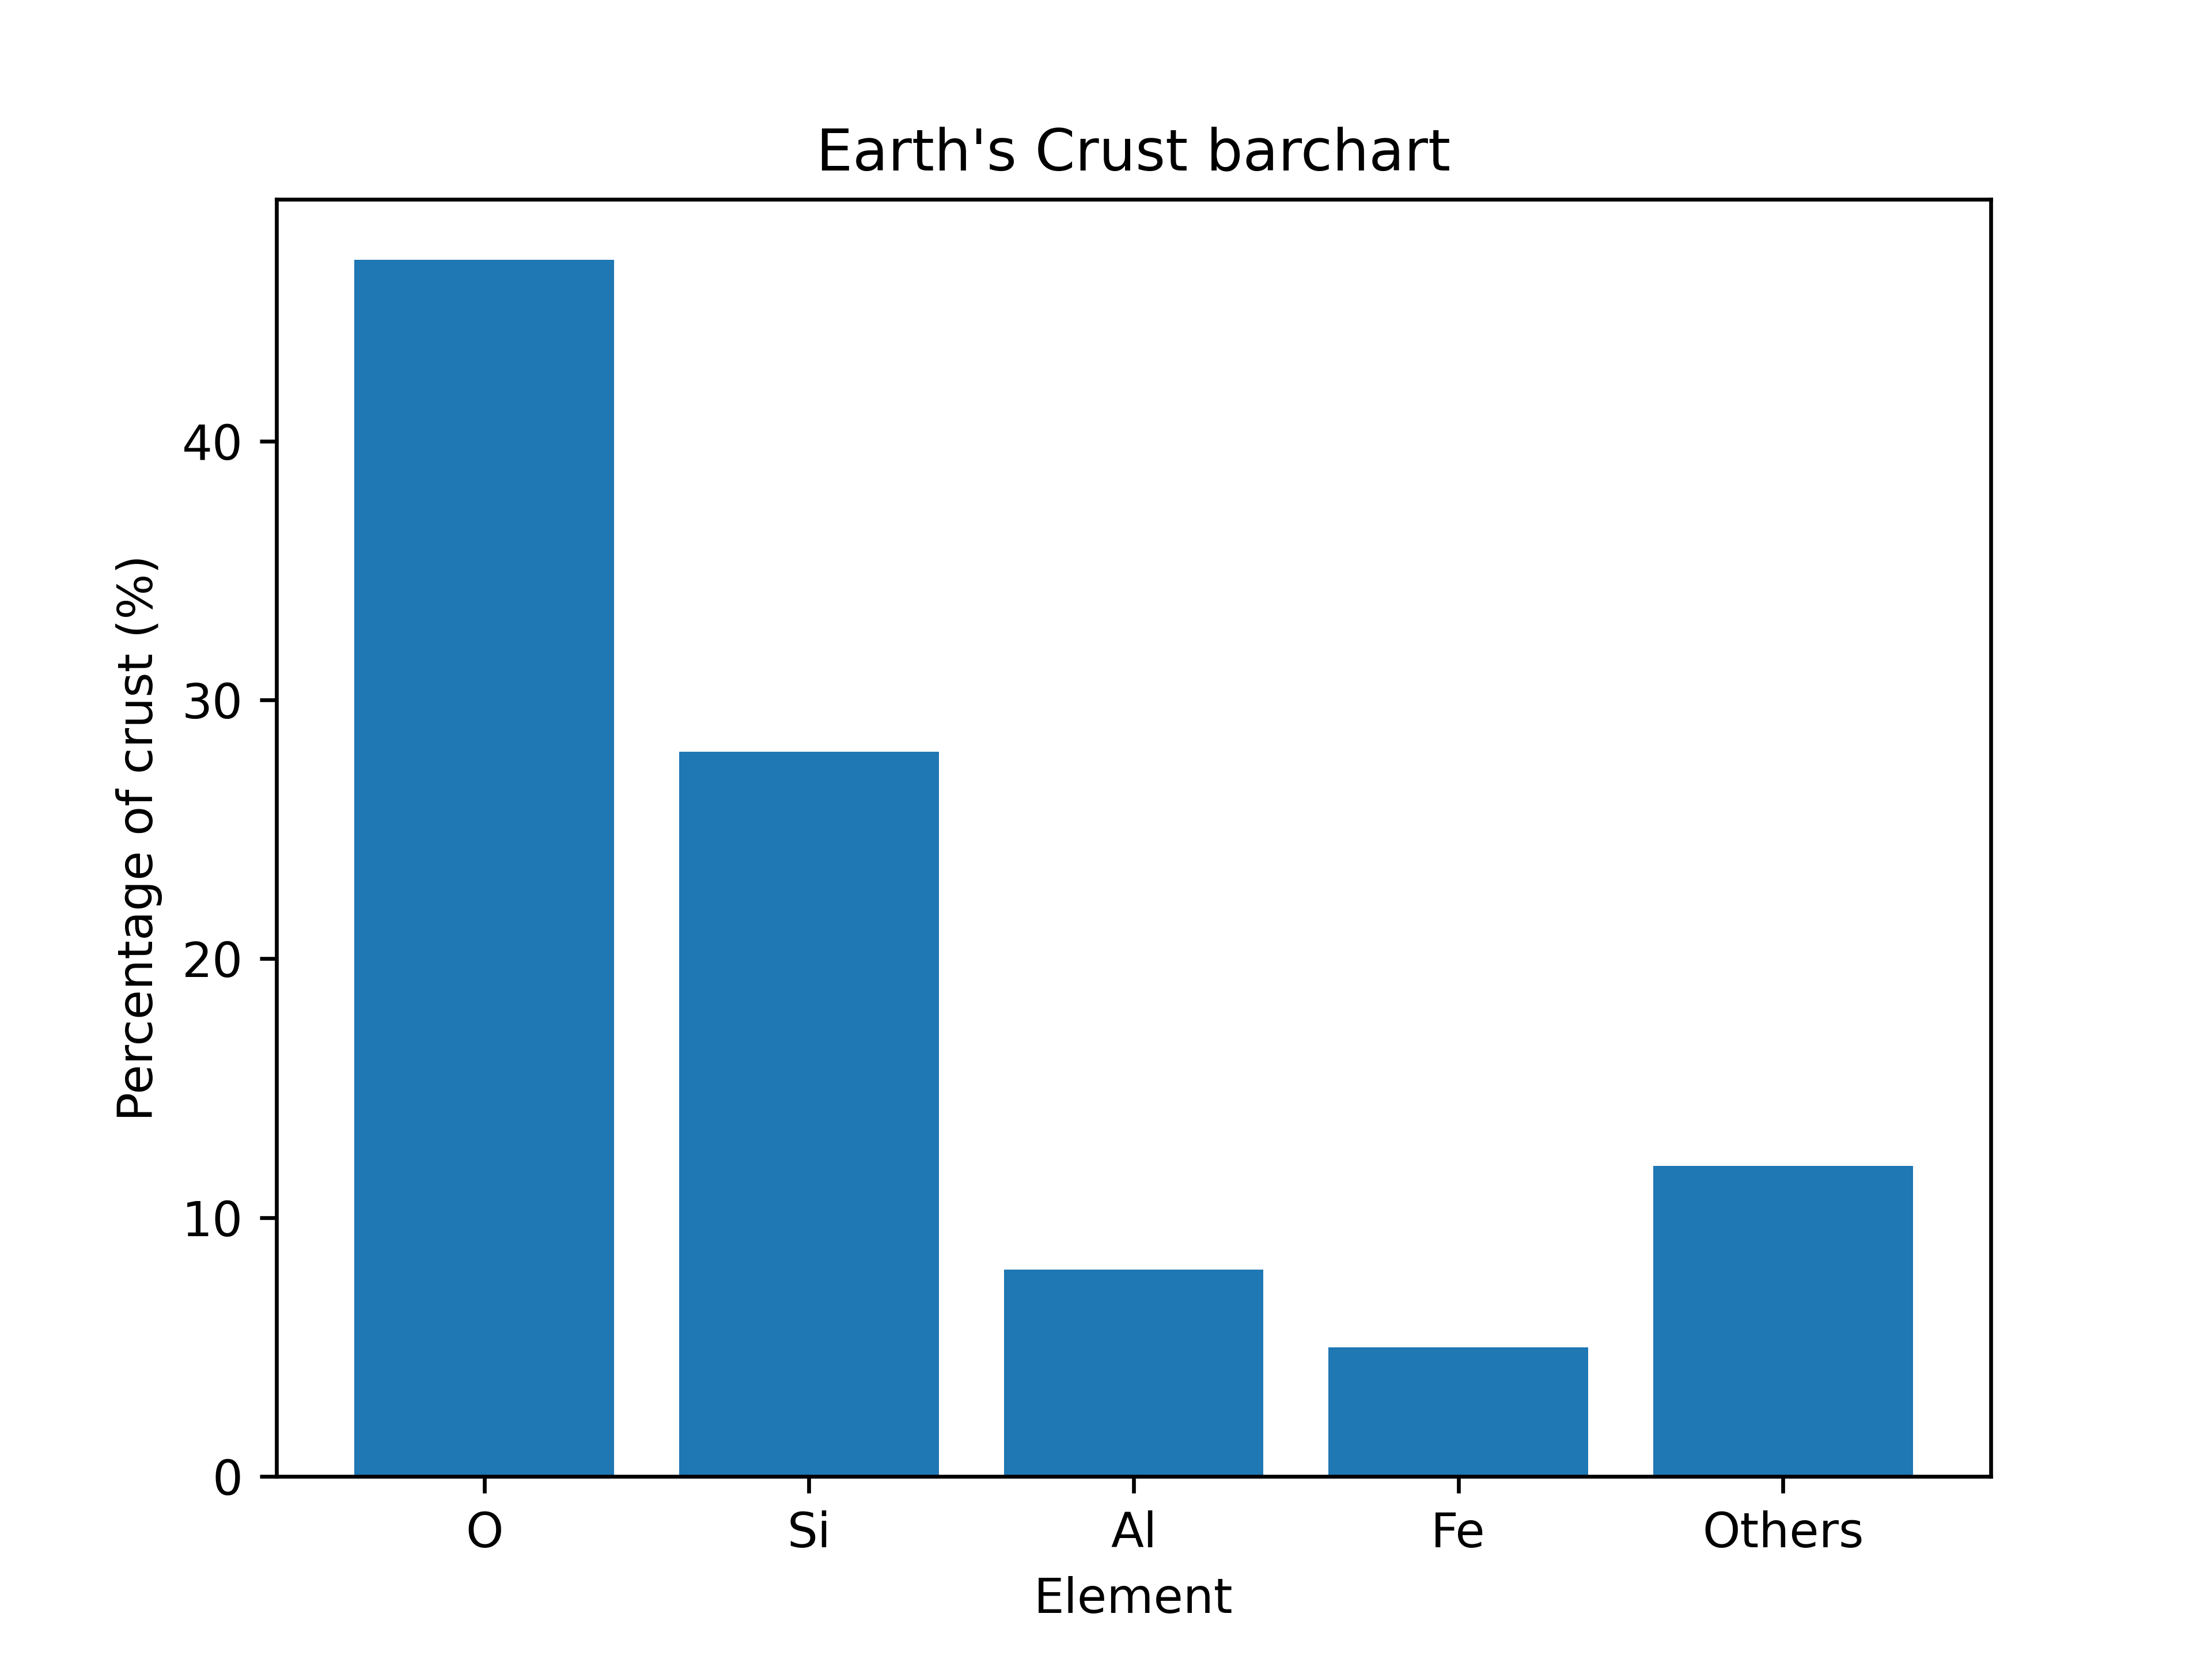
2.1. Simple bar chart
This is a simple bar chart.
2.2. Python code
The python code is below.
The code is commented to indicate what each part is doing.
 1import matplotlib.pyplot as plt
 2
 3
 4def plot_bar_chart(data, labels, title, xlabel, ylabel):
 5    # Plot the bar chart with the given data, labels, and formatting options
 6    plt.bar(labels, data)
 7    # X and Y labels
 8    plt.xlabel(xlabel)
 9    plt.ylabel(ylabel)
10    # Add a title to the plot
11    plt.title(title)
12    # Show plot
13    plt.show()
14
15
16def earth_elements():
17    # Data to plot
18    data = [47, 28, 8, 5, 12]
19    # Labels for each wedge of the pie chart
20    labels = ['O', 'Si', 'Al', 'Fe', 'Others']
21    # Title for plot
22    title = "Earth's Crust barchart"
23    # X axis label
24    xlabel = "Element"
25    # Y axis label
26    ylabel = "Percentage of crust (%)"
27    # Call the function to plot the data with given data, labels, title axis labels
28    plot_bar_chart(data, labels, title, xlabel, ylabel)
29
30
31if __name__ == '__main__':
32    earth_elements()
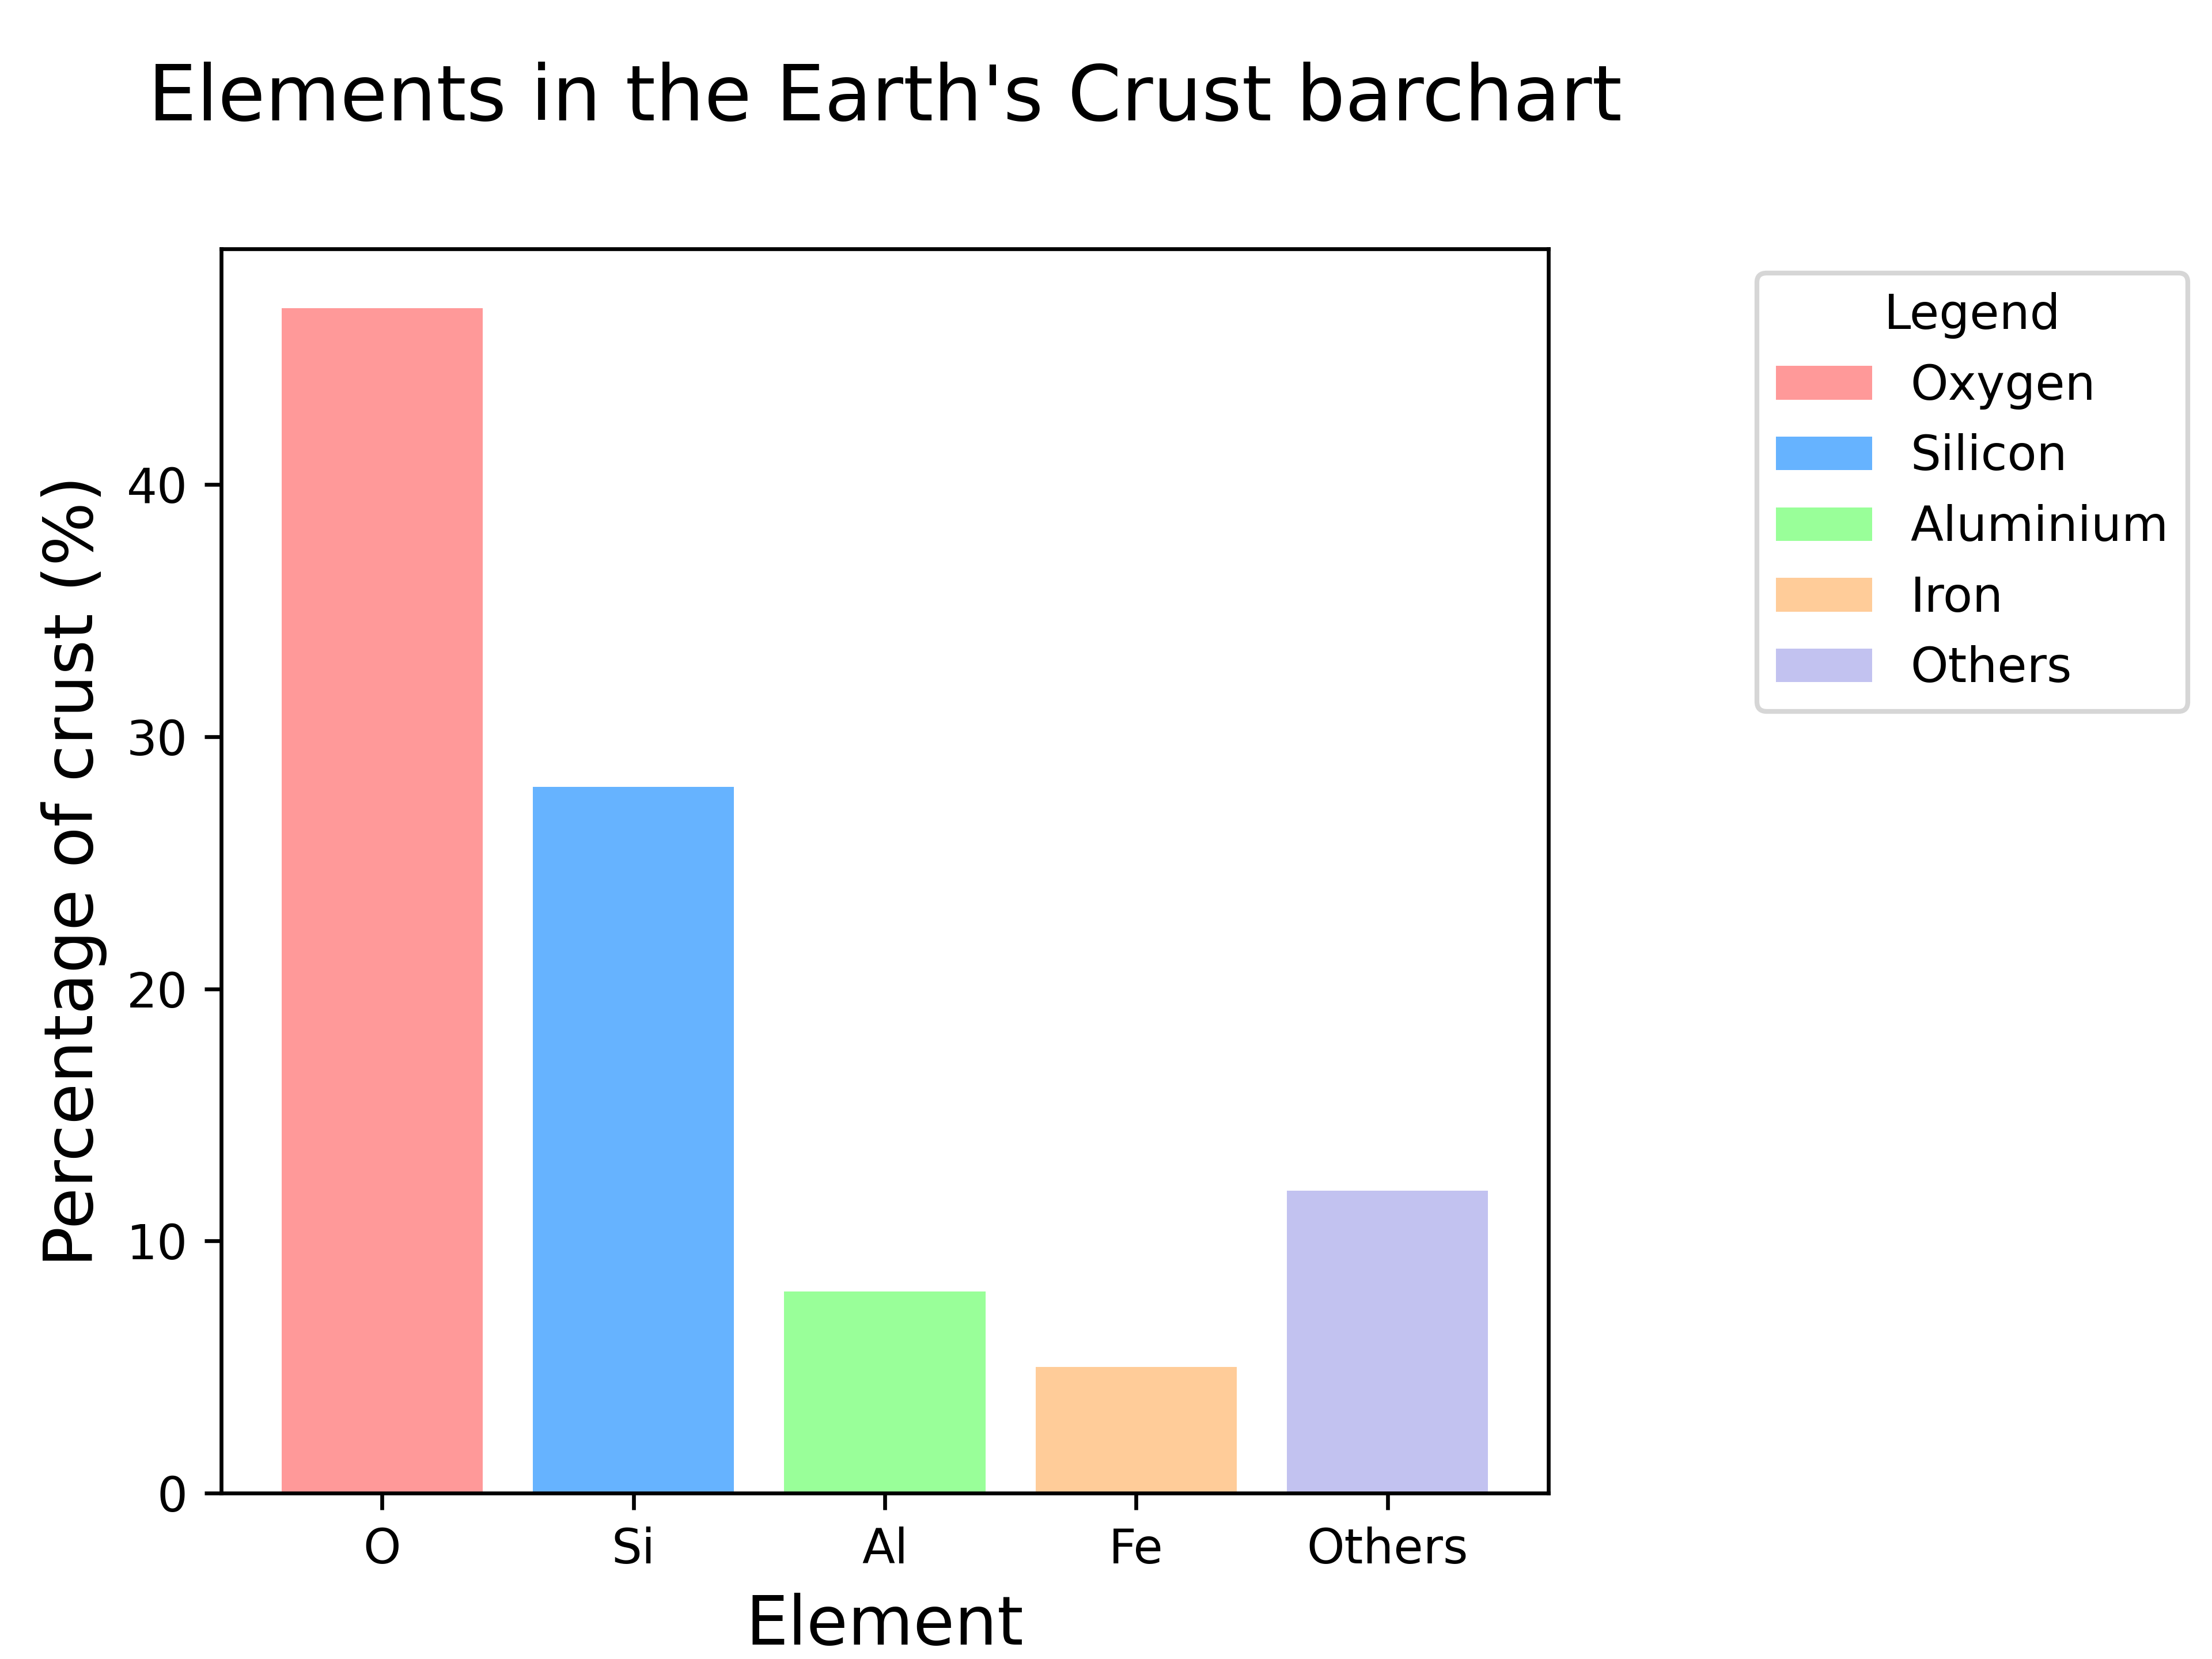
2.3. Customized bar chart
This plot has more customizations added.
It has code to save the bar chart as a png file.
2.4. Python code
The python code is below.
The code is commented to indicate what each part is doing.
 1import matplotlib.pyplot as plt
 2import numpy as np
 3from pathlib import Path
 4from matplotlib.patches import Patch
 5
 6
 7def plot_bar_chart(data, labels, legend_labels, title, xlabel, ylabel):
 8    # Define the colors to use for the bar chart
 9    colors = ['#ff9999', '#66b3ff', '#99ff99', '#ffcc99', '#c2c2f0']
10    # Plot the bar chart with the given data, labels, and formatting options
11    plt.bar(labels, data, color=colors)
12    # Add some space around the plot
13    plt.subplots_adjust(left=0.1, right=0.70, top=0.85, bottom=0.1)
14    # X and Y labels
15    plt.xlabel(xlabel, fontsize=14)
16    plt.ylabel(ylabel, fontsize=14)
17    # Add a title to the plot
18    plt.title(title, y=1.08, size=16)
19    # Create a list of Patch objects with the same colors as the bars in the bar chart
20    legend_elements = [Patch(facecolor=color, label=label) for color, label in zip(colors, legend_labels)]
21    # Add a legend to the plot using the given legend_labels and colors from the bar chart
22    plt.legend(handles=legend_elements, title="Legend", loc="upper right", bbox_to_anchor=(1, 0, 0.5, 1))
23    # Get the directory of the current file
24    currfile_dir = Path(__file__).parent
25    # Replace spaces in title with underscores to create filename for saving figure
26    filename = title.replace(" ", "_")
27    # build the image file path
28    filepath = currfile_dir / (f"{filename}.png")
29    # Save figure (dpi 300 is good when saving so graph has high resolution)
30    plt.savefig(filepath, dpi=600)
31    # Show plot
32    plt.show()
33
34
35def earth_elements():
36    # Data to plot
37    data = [47, 28, 8, 5, 12]
38    # Labels for each wedge of the pie chart
39    labels = ['O', 'Si', 'Al', 'Fe', 'Others']
40    # Full labels for legend
41    legend_labels = ['Oxygen', 'Silicon', 'Aluminium', 'Iron', 'Others']
42    # Title for plot and filename for saving figure
43    title = "Elements in the Earth's Crust barchart"
44    # X axis label
45    xlabel = "Element"
46    # Y axis label
47    ylabel = "Percentage of crust (%)"
48    # Call the function to plot the data with given data, labels, legend_labels, title and axis labels.
49    plot_bar_chart(data, labels, legend_labels, title, xlabel, ylabel)
50
51
52if __name__ == '__main__':
53    earth_elements()