10. Matplotlib plot multiple lines
Matplotlib can be used to draw a graph with multiple lines.
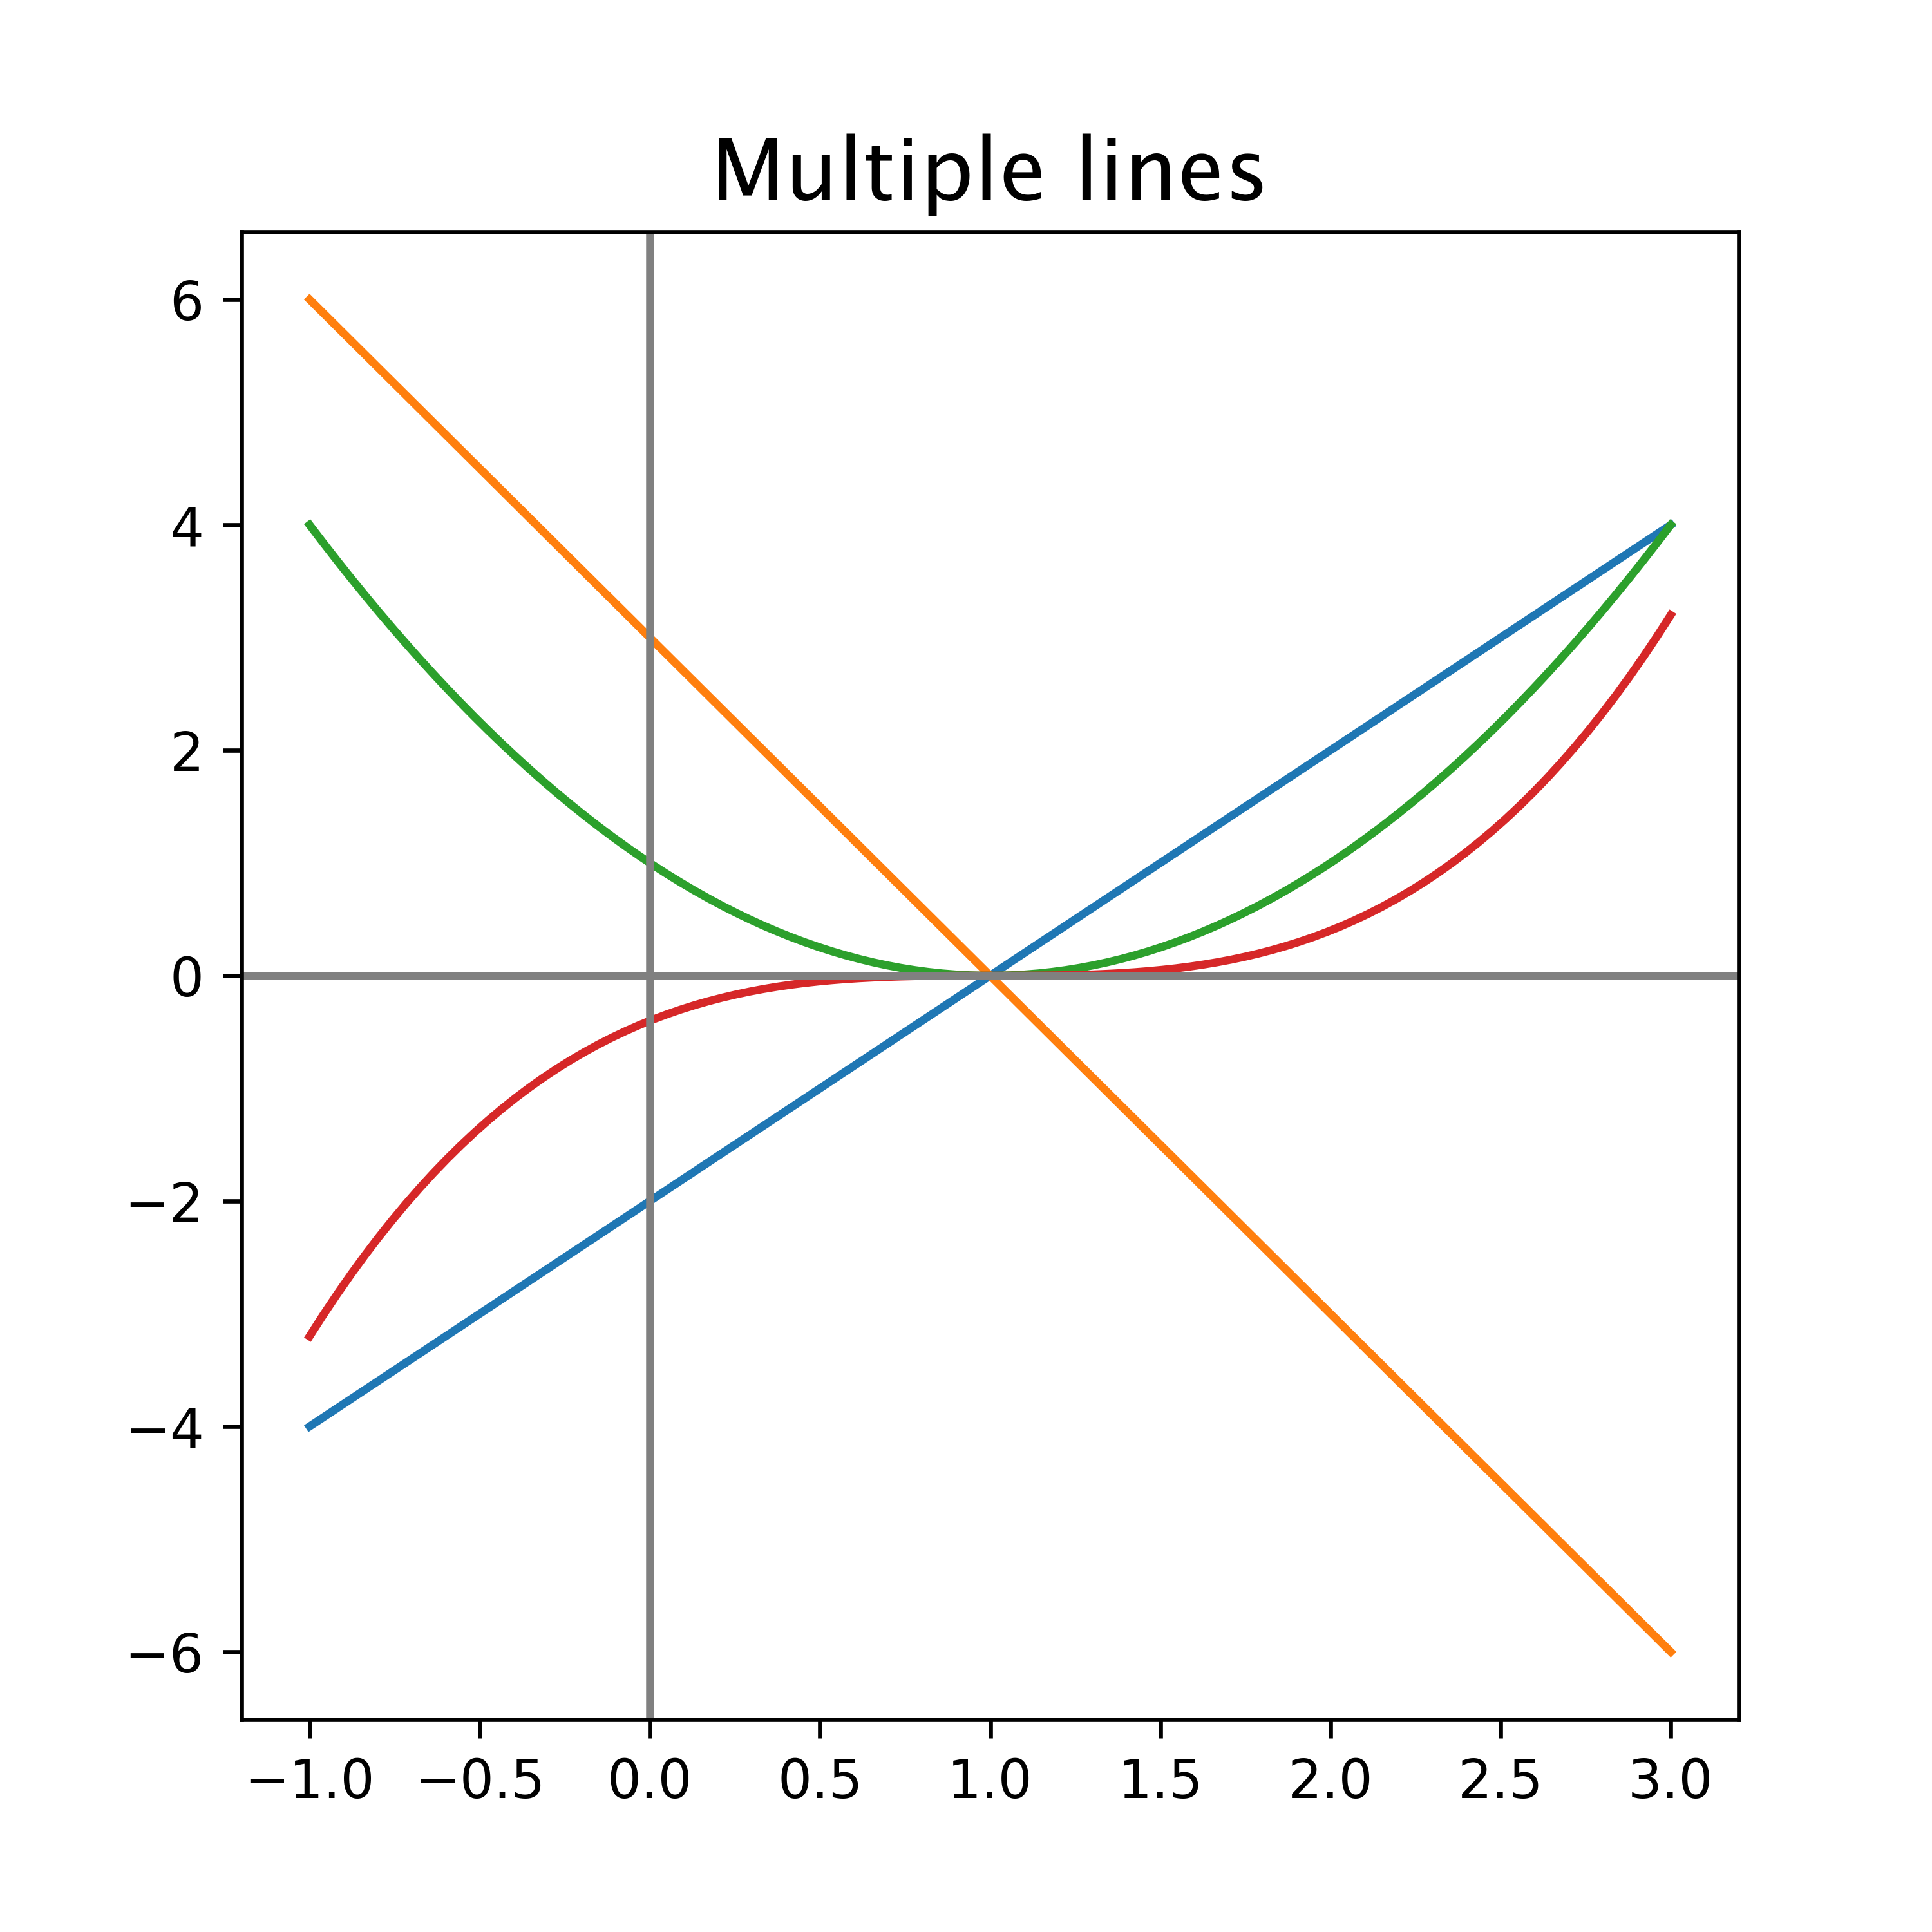
10.1. Simple Multiple line plot
This is a basic plot for the equations y = 2x - 2, y = -3x + 3, y = (x - 1)2, y = 0.4(x - 1)3.
It has X and Y axes.
10.2. Python code
The python code is below.
The code is commented to indicate what each part is doing.
 1import numpy as np
 2import matplotlib.pyplot as plt
 3
 4
 5def plot_line_graph(title, equations, min_x, max_x):
 6    """Plots line graphs of given equations.
 7
 8    Args:
 9        title (str): The title of the graph.
10        equations (list of str): A list of strings representing the equations to be plotted.
11        min_x (int): The minimum value of x to plot.
12        max_x (int): The maximum value of x to plot.
13
14    Returns:
15        None
16    """
17    # Size the Graph
18    fig = plt.figure(figsize=(5,5), dpi=100)
19    # Define the range of x values
20    x = np.linspace(min_x, max_x, 100)
21    # plot each equation
22    for equation in equations:
23        # Calculate the corresponding y values
24        y = eval(equation)
25        # Plot the line graph
26        plt.plot(x, y)
27    # Add x, y axis lines through the origin
28    plt.axhline(0, color="gray", linestyle="-")
29    plt.axvline(0, color="gray", linestyle="-")
30    # Add a title (specify font parameters with fontdict)
31    plt.title(title, fontdict={"fontname": "Lucida Sans", "fontsize": 16})
32    # Show plot
33    plt.show()
34
35
36def main():
37    plot_line_graph("Multiple lines", ["2 * x - 2", "-3 * x + 3", "(x-1)**2", "0.4*(x-1)**3"], -1, 3)
38
39
40if __name__ == '__main__':
41    main()
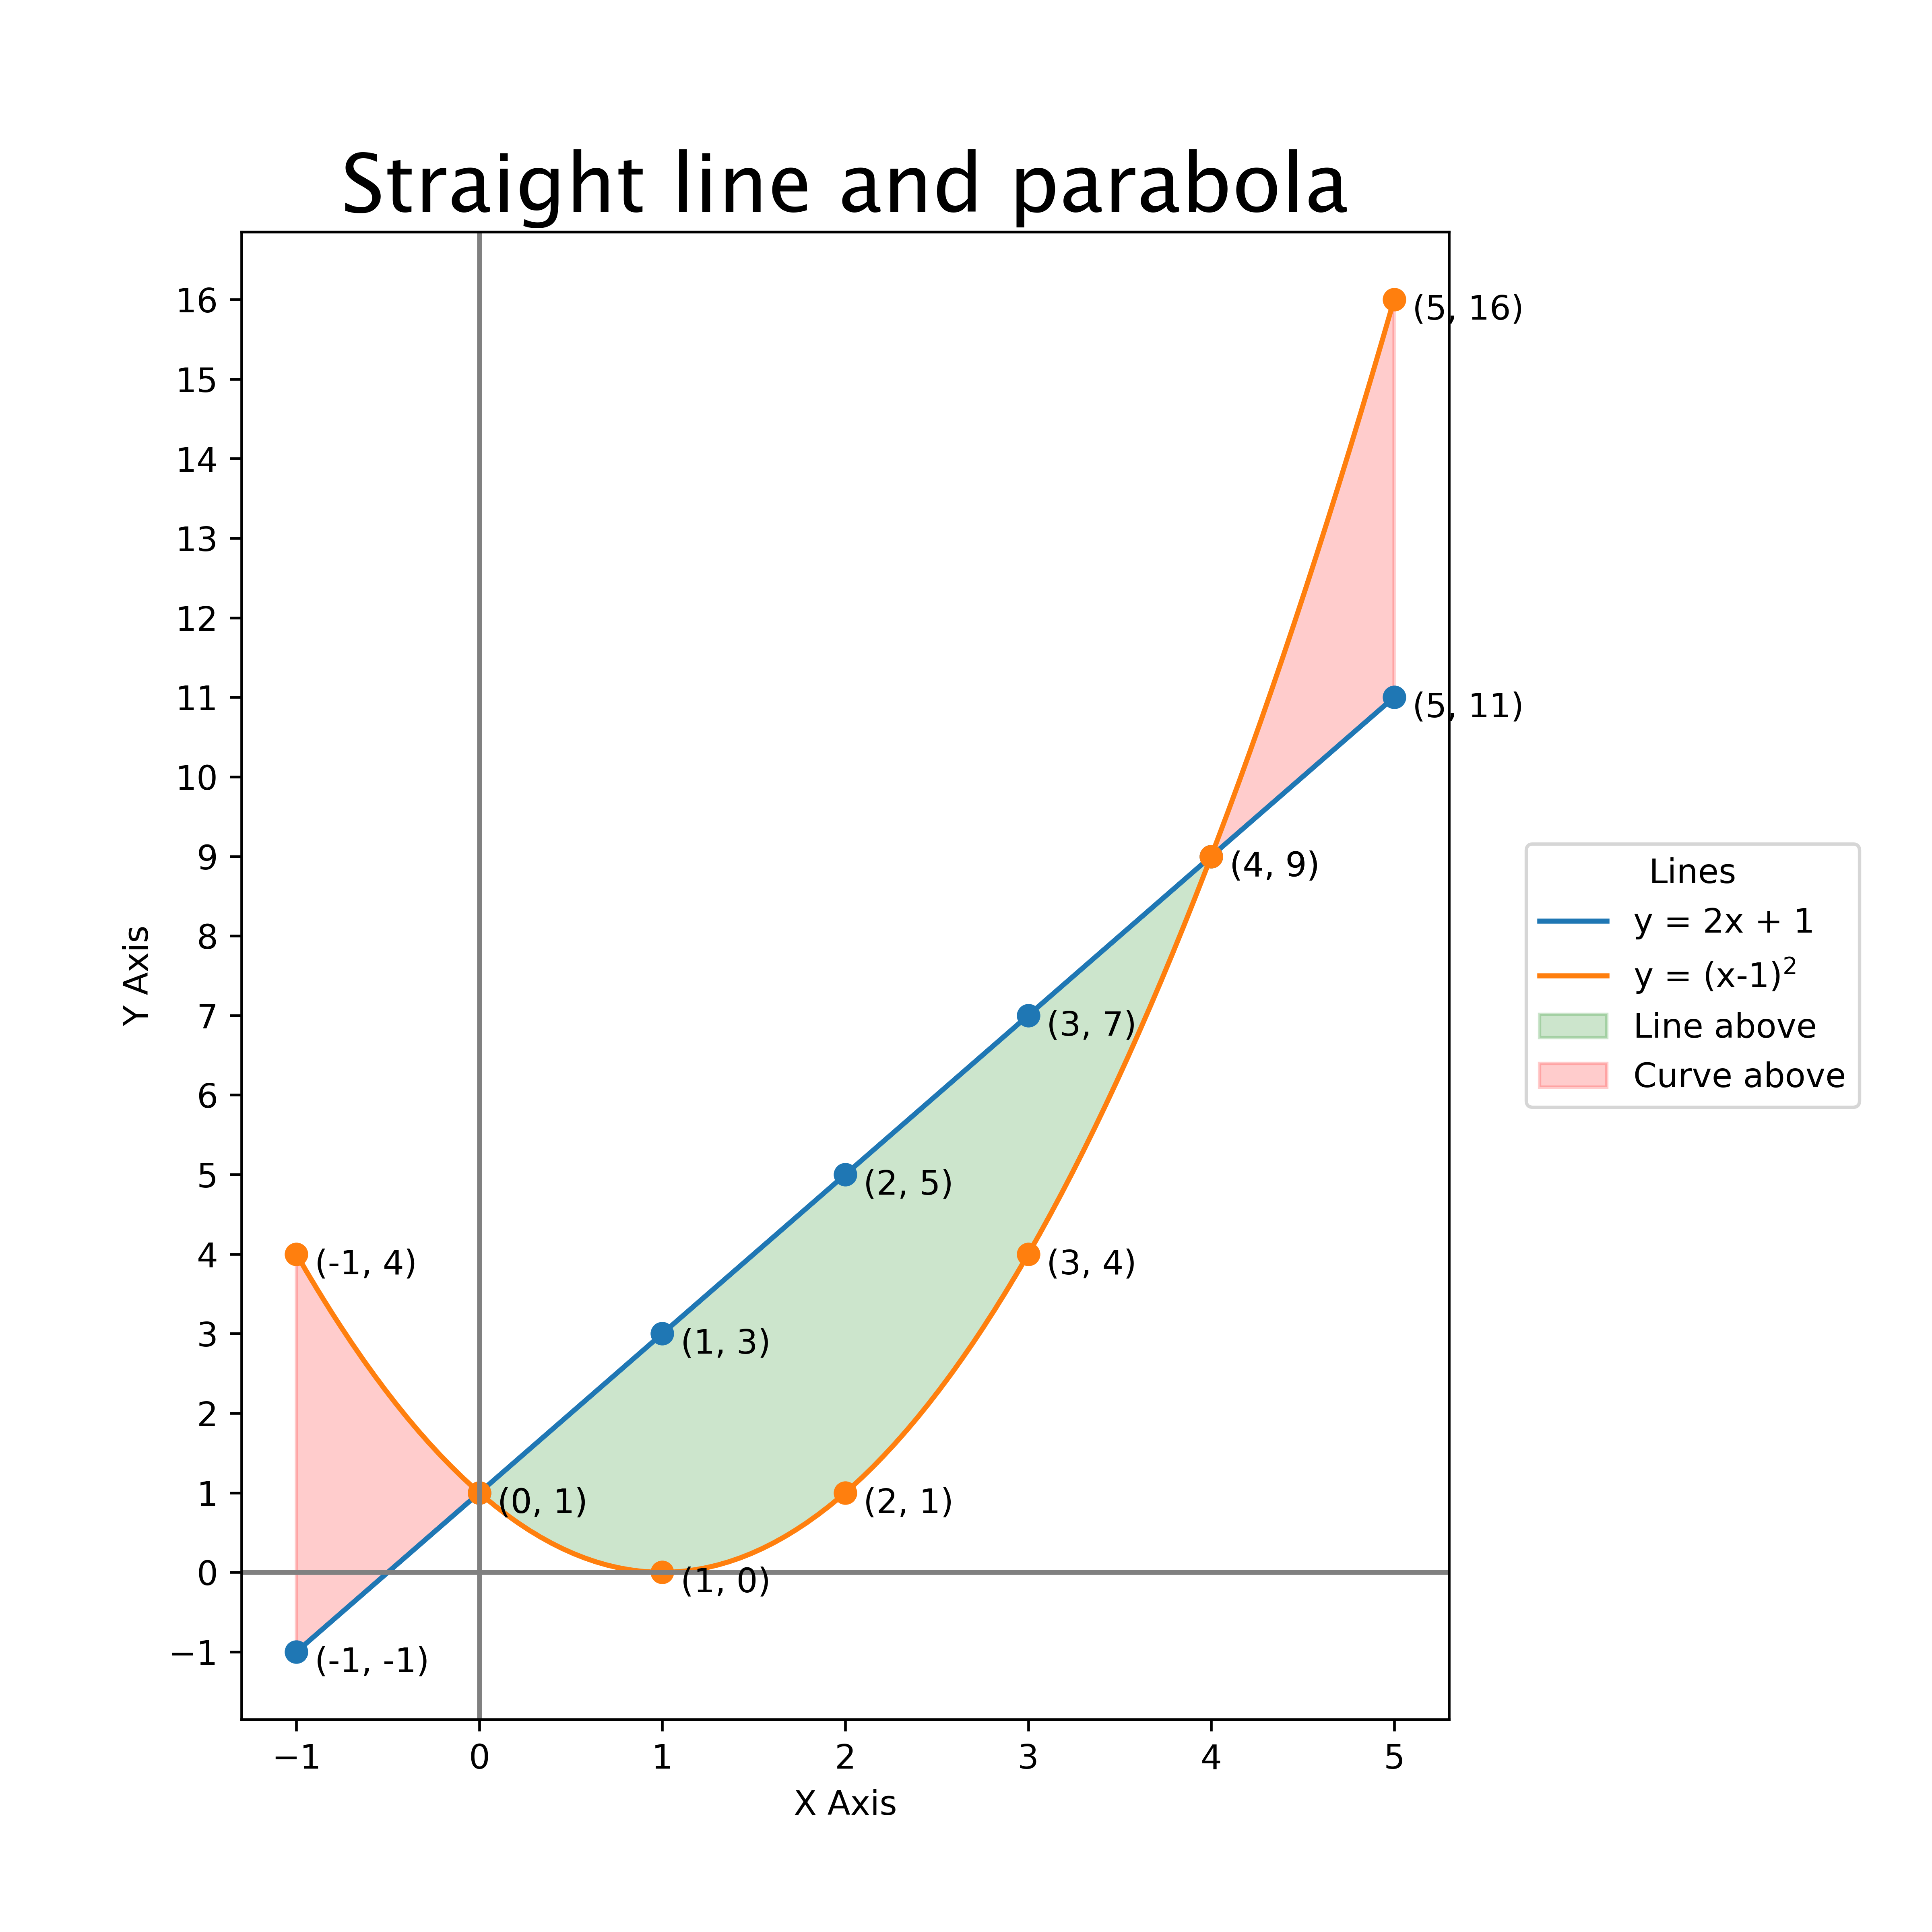
10.3. Straight line graph with parabola
This is a plot for the equation y = 2x + 1 and y = (x - 1)2.
This plot has more customizations added.
It has code to save the plot as a png file.
10.4. Python code
The python code is below.
The code is commented to indicate what each part is doing.
 1from pathlib import Path
 2import numpy as np
 3import matplotlib.pyplot as plt
 4
 5
 6def plot_line_graph(title, equations, labels):
 7    """Plots line graphs of given equations and labels them.
 8
 9    Args:
10        title (str): The title of the graph.
11        equations (list of str): A list of strings representing the equations to be plotted.
12        labels (list of str): A list of strings representing the labels for each equation.
13
14    Returns:
15        None
16    """
17    # Define the range of x values
18    x = np.linspace(-1, 5, 100)
19    # Resize the Graph (dpi specifies pixels per inch. When saving probably should use 300 if possible)
20    fig = plt.figure(figsize=(8, 8), dpi=100)
21    # Adjust subplot parameters to make room for the legend
22    fig.subplots_adjust(right=0.75)
23    # set initial y_min and y_max that will be used for y ticks
24    y_min = 0
25    y_max = 0
26    for i, (equation, label) in enumerate(zip(equations, labels)):
27        # Calculate the corresponding y values
28        y = eval(equation)
29        # since y is an array, need to do min(y) first before combining with y_min
30        y_min = int(min(min(y), y_min))
31        y_max = int(max(max(y), y_max))
32        # use default colours C0, C1...C9
33        color = f'C{i}'
34        # Plot the line graph
35        plt.plot(x, y, label=label, color=color)
36        # Create a lambda function from the equation string to allow use of variable xi
37        f = eval("lambda x: " + equation)
38        # Label each point on the graph for x = -1 to 5 as integers
39        for j in range(-1, 6):
40            xi = j
41            yi = f(xi)
42            plt.plot(xi, yi, "o", color=color)
43            # test to see if value is an integer so y coordinates can avoid using decimals
44            if int(yi) == yi:
45                plt.text(xi+0.1, yi-0.25, f"({xi}, {int(yi)})", fontsize=10)
46            else:
47                plt.text(xi+0.1, yi-0.25, f"({xi}, {yi:.2f})", fontsize=10)
48    # Calculate the corresponding y values for both lines
49    y1 = eval(equations[0])
50    y2 = eval(equations[1])
51    # Fill the area between the two lines
52    plt.fill_between(x, y1, y2, where=(y1 > y2), interpolate=True, color='green', alpha=0.2, label="Line above")
53    plt.fill_between(x, y1, y2, where=(y1 <= y2), interpolate=True, color='red', alpha=0.2, label="Curve above")
54    # Add a x, y axis lines through the origin
55    plt.axhline(0, color="gray", linestyle="-")
56    plt.axvline(0, color="gray", linestyle="-")
57    # Add a title (specify font parameters with fontdict)
58    plt.title(title, fontdict={"fontname": "Lucida Sans", "fontsize": 24})
59    # X and Y labels
60    plt.xlabel("X Axis")
61    plt.ylabel("Y Axis")
62    # specify X axis Tickmarks (will resize graph)
63    plt.xticks(np.arange(-1, 6))
64    # Set y-axis tick marks to be every 1
65    plt.yticks(range(y_min, y_max+1))
66    # Place legend outside plot at top right, making extra room for it
67    plt.legend(title="Lines", loc='center left', bbox_to_anchor=(1.05, 0.5))
68    # Get the directory of the current file
69    currfile_dir = Path(__file__).parent
70    # Replace spaces in title with underscores to create filename for saving figure
71    filename = title.replace(" ", "_")
72    # build the image file path
73    filepath = currfile_dir / (f"{filename}.png")
74    # Save figure (dpi 300 is good when saving so graph has high resolution)
75    plt.savefig(filepath, dpi=600)
76    # Show plot
77    plt.show()
78
79
80def main():
81    plot_line_graph("Straight line and parabola", ["2 * x + 1", "(x-1)**2"], ["y = 2x + 1", r"y = (x-1)$^2$"])
82
83
84if __name__ == '__main__':
85    main()